Trading Articles
Astronomical Timing Models in the Stock Market: A Structured Examination
When I first began trading more than five decades ago, I was told by one of my mentors that trading was a journey, not a destination. Those words have been emblazoned on my brain since that time. The library I’ve accumulated over the past years has just about everything published, as well as many things not published, and I’m still learning. But, my first experience with technical analysis was when I was in graduate school and one of my professors had some large charts of US Steel, Corn, Soybeans and General Motors posted on his office wall. Each day, he’d mark these little bars on his charts with notations. The class was always curious as to why he did this. It would be years before I would understand the significance of his daily ritual.
Purpose of This Article
The purpose of this article is twofold. To:
- 1. Describe the journey that got me to the point where I am today
- 2. Stimulate interest in a subject most people either cringe or laugh at when they hear it mentioned — the A word…ASTROLOGY (and, more importantly, how it relates to trading)
My experience with astrology began in the late 60s when I was studying the works of W. D. Gann, George Bayer, Luther Jenson and Cmmdr. David Williams. It wasn’t until 1976, when I was running the commodity department for Drexel Burnham Lambert in California, that my interest in astrology accelerated. Early one morning, a middle-aged housewife (at the time she was considered middle-aged, but, now, she’d be considered young) came into my office in Beverly Hills and told me that she could trade silver using astrology. Her problem was that she did not have any money, and she couldn’t get anyone to believe that she could do this.
After a brief discussion, I suggested opening an account for her that I would trade using her signals, and we would split the profits. The results that followed were nothing short of spectacular. She was right on 19 consecutive signals in the silver market. A few years later, my good friend and trading partner, Jim Twentyman, and I reconstructed how she was trading. We could accomplish this because her orders were very unusual, to say the least. She would give me an order to buy silver at a certain time of the day (for example, at 7:16 a.m., and to sell it at 10:00 a.m. 2 days later, disregarding price).
Although the results could not be challenged, her methodology had some basic flaws. The first flaw was that she disregarded the fact that silver was in the beginning of the largest bull market of all times, and she only did long positions. The second flaw was that she did not use stop loss orders, and, although the positions would sometimes go dramatically against her, by the time the position was to be liquidated, the market would have recovered for a modest profit.
How I Became Interested in Astrology and Its Relationship to Market Cycles
You have to understand that this was not a shot in the dark for me, this idea of taking positions based on astrology, because I had discovered early on in my trading career that the cycles of the market were related to astrology. I found this out just by looking at lunar phenomena and the eclipses. Plus, the work that was done by W.D. Gann and Comdr. David Williams catapulted me into the study of cycles. I was fortunate enough to be one of the first proponents of the ideas espoused in James Hurst’s book Profit Magic of Stock Transaction Timing and the subsequent charting service called Cyclitech.
Through the years, there have been many references made to astrology and its influence on the stock market. One of the most famous came from one of the most famous men in all of investing, whose name still appears on two of the finest financial institutions in the world. That man was John Pierpoint Morgan (JP Morgan and Morgan Stanley). One of JP Morgan’s most famous quotes was that millionaires do not use astrology in the stock market; billionaires do. Morgan had a full-time astrologer by the name of Evangeline Adams who worked with him throughout his financial career.
The JP Morgan home has been converted into a beautiful museum just north of Rockefeller Center in NYC. In it, Morgan’s library, a work of art in itself, has a ceiling featuring a hand-painted celestial reproduction of the heavens with a secret passage into the library from the living quarters, located directly above JP’s birth sign. The reason I mention some of these things is to try to alert skeptical readers to the fact that a number of very powerful people have examined this particular scientific discipline. Other examples include Isaac Newton, Albert Einstein and Galileo.
The Origins of the Bradley Stock Market Model and How I Became Familiar with It
My first introduction to the Bradley stock market cycle in 1986 came about as a result of my previous trading for a prominent soybean farmer / trader in southern Indiana. His wife, Dr. Ruth Miller, was a college professor who contacted me several years after her husband’s death to give me some information she thought I would find very useful in my daily charting. Ruth explained that she had discovered, through many years of study, that the Fibonacci sequence of numbers I use in my daily trading was directly related to the planetary positions of the market. Without doubt, this contact with Dr. Miller has been the single-most profound thing that has ever happened to my trading.
What follows next might sound like a contradiction of terms: I think it’s important that readers understand that I am pattern recognition swing trader. And, yet, I use very little astrology in my day-to-day operations in the markets. Primarily, I do short-term swings lasting anywhere from a few minutes to a few days at most. I’ve never been able to buy a stock, such as Google at $80, and watch it go to $450. What I have discovered, though, is that the discipline involved in the study of astrology (astronomy) has made me more keenly aware of the harmony in the underlying patterns in everything in the universe, including the markets and, thus, more open to the possibilities for trading those patterns represent. Thus, it was, that I discovered the Bradley Stock Market Model.
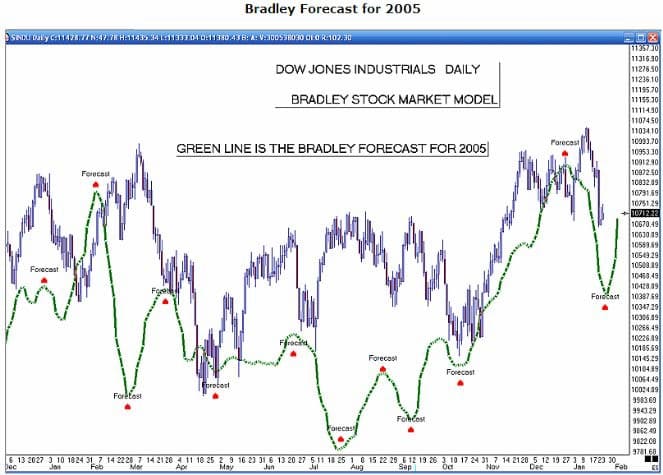
Donald Bradley wrote a small pamphlet titled Stock Market Predictions in 1947 and sold it for the astronomical price of $4.00, which in 1947 dollars was quite a bit. Bradley took the 12 planets and gave them a positive or negative rating. From this rating, he produced a sidereal graph that gave a trend for the stock market for the next year, and the next, and the next. In fact, it could go out hundreds of years. The pamphlet had only one year of the stock market (1946), but it illustrated how well the correlation of his model to the actual price pattern worked for that year.
Unfortunately, no one ever followed up for years, and his work fell into obscurity until 1986 when Jim Twentyman and I began looking at the Bradley model. We had all of the stock market data on the NYSE from 1876 (10 years after the civil war) through 1986. A 110-year sample size was statistically accurate enough to test his theory. My good friend, Neal Michelson of Astro Computing Services, programmed the Bradley model, and we took the data and matched it to those 110 years. (As a side note, Neal’s company, Astro Computing, provided the U.S. Navy with all of its vital information for the U.S. fleets.)
Advanced Books and Courses on Astro Trading
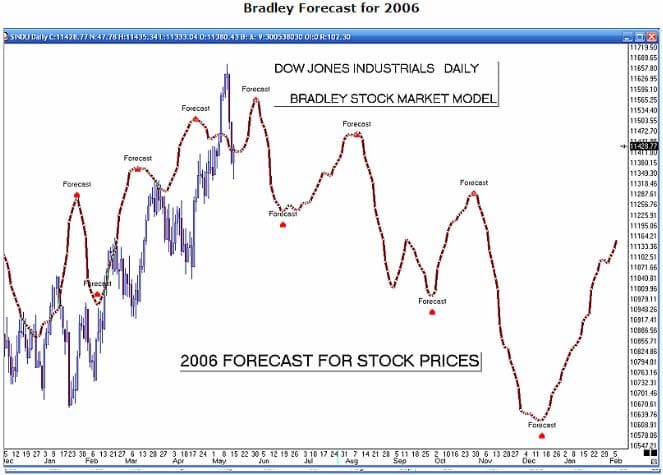
As you can see from the small two-year example shown in this article, the results were quite amazing. Over the past 130 years (since 1876), the correlation is better than 70 percent. Remember that this model can be done years in advance. It is one small indication that the planets may have some say in what happens in the markets.
Two Caveats Concerning the Bradley Model
Although the Bradley Model shows some excellent correlations between naturally occurring cycles and the Dow Jones Industrial Average, I must mention certain caveats. First, the Bradley Model has a tendency to invert (be a mirror image of) the regular model at certain times during the year. Sometimes, there are as many as three inversions in a year while, at other times, there are no inversions, and the model correlates quite well. Inversions can be a problem, but they also present an opportunity because the exact Bradley date (calendar date) has a very high probability of being near a significant trend change, plus or minus one day, better than 80 percent of the time.
The second caveat relates to the fact that the Bradley Model is not a trading system; it is a guideline for what the Dow Jones Industrial Average may or may not do between the Bradley dates. Practical experience has shown that, when the Bradley model is working, it behooves the trader to pay attention to the high correlation existing at that time. However, when it is not correlating, it should be viewed with skepticism. So, it was never meant to be a trading system. In fact, it is still an unproven theory.
My Predictions about the Bradley Model
I will go out on a limb here and make an historical prediction that, sometime within the next five years, a major academic institution will stumble across the Bradley Model, do some empirical research on it and publish its findings. A short time after the publication, the financial news channels and financial press will bring it to the attention of the investing public and take astrology out of the category of voodoo economics. Finally, the Bradley dates for the remainder of 2006 are listed on the accompanying Dow Jones Industrials 2006 chart. It’ll be interesting to see how this correlates with overall market performance and if the Bradley dates do, in fact, have significant turning dates for the remainder of 2006.