Trading Articles
Forex Entry By Gareth Burgess

In the foreign exchange markets, where moves can be fast and substantial, timing is everything. This market timing entry setup can increase your chances of success. As a retail trader, I believe there is less than a 50% chance of making money from trading without a technique to signal your entry into the market. Even if you are 90% sure of the direction, as soon as you place a position in the market and it goes against you, your emotions will overwhelm you. A potentially good trade can quickly turn into a loss because you can’t trust your emotions. Chart trading, however, increases the odds if you work with some sort of technical setup — one that you feel comfortable with, one that you have backtested and are confident with. A good technique can increase the chances of your success by up to 80%.
DETERMINE THE OPENING RANGE
One method for timing your market entries requires finding the opening range and marking the high and low on the short-term chart. You cannot change the time frame just so the method, which needs to be used consistently, fits the current market price action. You must remain with the setup. This technique can be used as an intraday technique that signals more trades per session or as an entry technique for a longer-term position. You must decide which time frame is right for you because it also requires you to be disciplined in your money management. Whether you are up to that challenge is something you will have to discover for yourself because the position size and duration of the trade will determine the criteria for your risk management.
Say I use a 10-pip warning level for the position I am entering. Once that warning level is reached, my stop level kicks in, but that could be an additional 15 pips away. So I am looking at a 25- to 30-pip stop-loss. However, because my warning occurs 10 pips away from the entry point, I have enough time to assess the situation. I can get out any time after 10 pips, but with a maximum of another 20 pips — 30 pips in all. This is important because it gives you time and prepares you for a possible minor loss.
The following time frames and technical indicators are necessary to create the opening range method:
- Daily candlestick chart with 10- and 30-day moving average
- 120-minute candlestick chart
- 15-minute candlestick chart with 34-bar simple moving average
- Five-minute candlestick chart with 34-bar simple moving average and volume.
To demonstrate this technical setup, I will begin by working down through the time frames, beginning with the daily chart.
THE TECHNICAL SETUP
Price action is never exactly the same in the markets, but the method I am applying here always is (see sidebar, “The setup at a glance”). Remember, when you’re looking for trade setups and entry levels, you’re basically looking for opportunities in the markets.
The setup at a glance
- Step 1: Find a directional bias on the daily chart. Make a note of your thoughts on market direction and keep them close by.
- Step 2: Transfer the most significant levels from the daily chart to the 15-minute and five-minute charts.
- Step 3: Find the opening range levels on the 120-minute chart and transfer these to the 15-minute and five-minute charts along with the other levels.
- Step 4: Place the 34-bar simple moving average onto the 15-minute chart.
- Step 5: Copy all levels from the 15-minute chart onto the five-minute one, and you have your entry setup.
- Step 6: Work from one side of the market only. For example, look to be a buyer when the daily bias is higher, and trade when the price action is at one of the levels.
To begin the technical setup, you must have a basic understanding of candlesticks and the simple moving average. As much as have been written about candlestick signals (both positive and negative), they are very useful in chart analysis, especially when it comes to observing market sentiment. My advice to anyone wanting to know more about candlesticks is simply to select some major candlestick patterns and test each signal over a 20-year period. See how often a hanging man appears, for example, and how long it takes before the signal takes effect on price action. Look at dojis and see what else you can apply to them, such as support and resistance levels at the extremes. I would not get too hung up about just using candlestick patterns and candlestick techniques, however, as they require years of experience and can still be very deceptive.
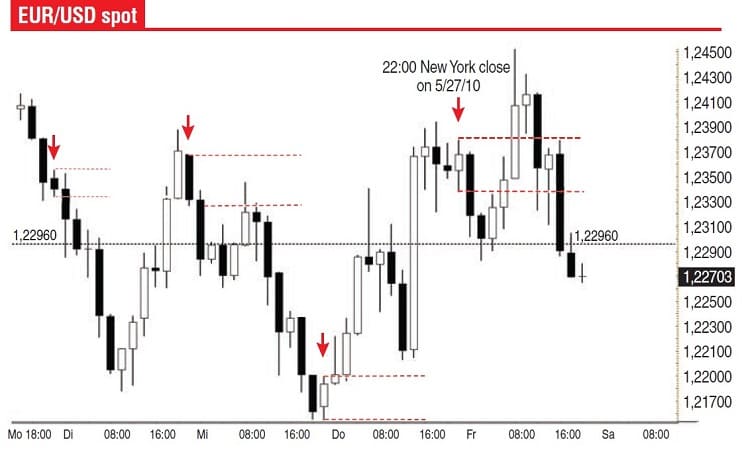
If you begin your analysis with the daily chart, you have to ask yourself what you think the day’s expected range will be. Applying candlesticks is very useful for finding potential market direction and, of course, the current market sentiment. Now, look for a familiar candlestick. For example, the daily chart of the euro/US dollar in Figure 1 displays a bullish engulfing pattern. Seeing this, you would want to find daytrades where you can be long the market. This type of candlestick pattern on a longer-term chart has little to do with an intraday trade. But if the price action is shifting to the upside, you will find that support levels on the intraday chart will have a stronger effect than resistance levels. So there will be a higher percentage of opportunities by working from the buy side.
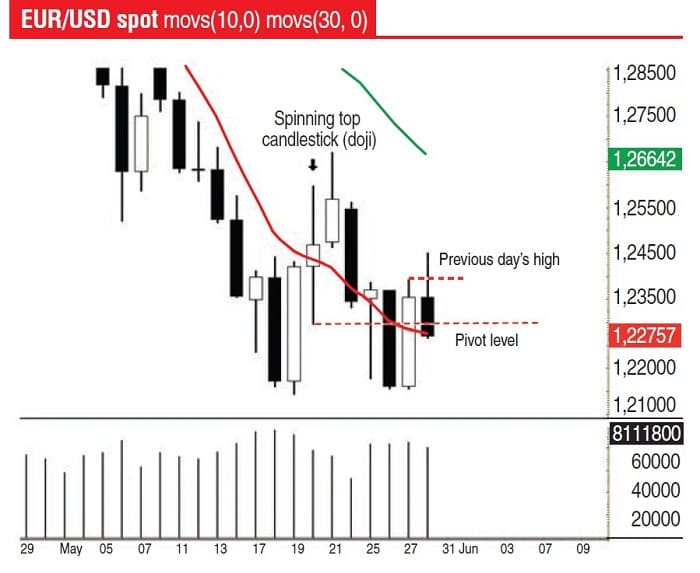
Technically, there is a reason for you to believe that the market will move to the upside rather than the downside, if only for the short term. There is high volume on the chart, and the previous session’s close was above the 10-day moving average.
In addition, if you look at the daily candlestick chart, you will see that on May 20, there was a type of doji or “spinning top” candlestick. This type of candle tends to signal uncertainty in the market. In this case, neither bulls nor bears won the match, but there was strong resistance and strong support. Extra emphasis should be placed on this type of candlestick because it has technical implications that can be long lasting. This type of candlestick can see a reaction at the same high or low for many weeks after it has been appeared on a chart.
For the purpose of this technical setup, however, you need to place the low of this candlestick, which is 1.2296 onto the 15-minute chart, and also need to transfer the 10-day moving average level from the daily chart to the 15-minute chart, which in this example is at the 1.2275 region.
Suggested Books and Courses About Trading Charts

APPLYING IT
So after forming an opinion about the market you are planning to trade, you must break the market down into time frames. For example, the first chart could be the daily time frame, the second chart could display the 120-minute time frame (used for finding the opening range), the third chart could show a 15-minute time frame, and the fourth chart could display a five-minute time frame, which you would use to determine the actual entry point of your trade.
The next step is to apply the high and low of the opening range to the charts. To do this you must find the New York close, which is at 2200 GMT and midnight GMT of the previous session. You define the opening range by taking the high and low of that two-hour period and apply these levels to the 15-minute chart and five-minute chart. The New York close is important because this is the time frame of the interbank market, and most research departments within banks will have the time frame set from 0000 GMT till 2200 GMT. This is very important for candlesticks on a daily chart basis.
As you will see from Figure 2, there are previous opening ranges applied. Once these levels are set, you have in effect established an opening range for the market. Two hours or 120 minutes is not very long when you consider the market is operating 24 hours. On a short-term basis, there are numerous (three in Figure 2) short-term trades based on these levels. For use as a signal, however, they are better placed on the 15- and five-minute charts.
After applying your opening range levels onto the 15-minute chart, a picture develops that will determine market direction and where support and resistance levels are likely to appear. These levels form the basis of your trading strategy. Remember, they are on a 24-hour market and work exceptionally well in the forex market, but they can be applied to any market worldwide.
Turning to the 15-minute chart in Figure 3, you can see that the opening range has been applied, the pivot low taken from the spinning top candlestick on the daily chart from May 20 has also been applied to the 15-minute chart, and the all-important 10-day moving average from the daily chart, which is at 1.2275, likewise appears on the 15-minute chart. Now you have to apply a short-term moving average to the 15-minute chart and eventually the five-minute chart. Personally, I find the 34-period simple moving average (34 being a Fibonacci number) to be quite effective on the short-term charts. Finally, you need to apply volume to the chart. Volume is like having inside information handed to you on a plate and is very important if you can get it.
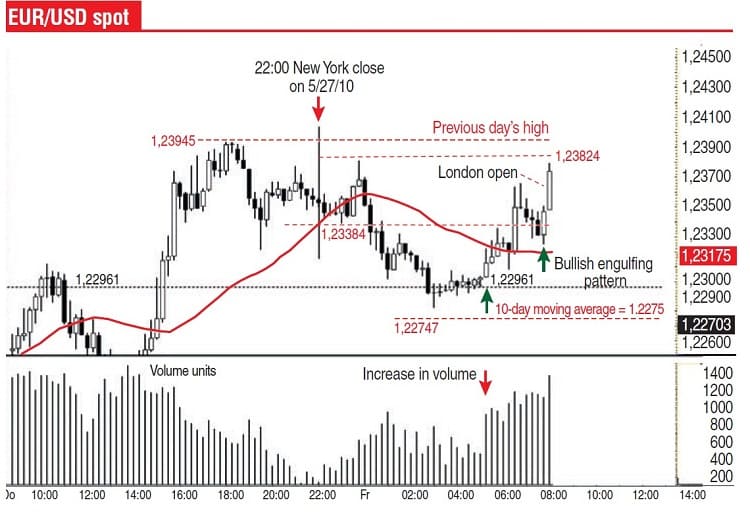
Your 15-minute chart should look something like the one you see in Figure 3. Looking at the session as it reaches the European and London opening, you can see that so far into the day, the pivot level at 1.22961 has held as support. Not only that, the 10-day moving average at 1.2275 applied to the 15-minute chart did not get breached, and the volume is a good indication that your bias to be long was correct. Volume gives you greater confidence. Here, volume picks up sharply on price action that is above the 1.22961 pivot level. This suggests buying is taking place and that the pivot level and the 10-day moving average are reliable levels of support so far.
By the time the markets open in London, price has already begun to trade back within the 120-minute opening range. In addition, the 34-minute simple moving average (SMA) on the 15-minute chart is providing a shelf of support that has enabled the price action to reach the opening range, confirmed by an increase in volume and a bullish engulfing candlestick.
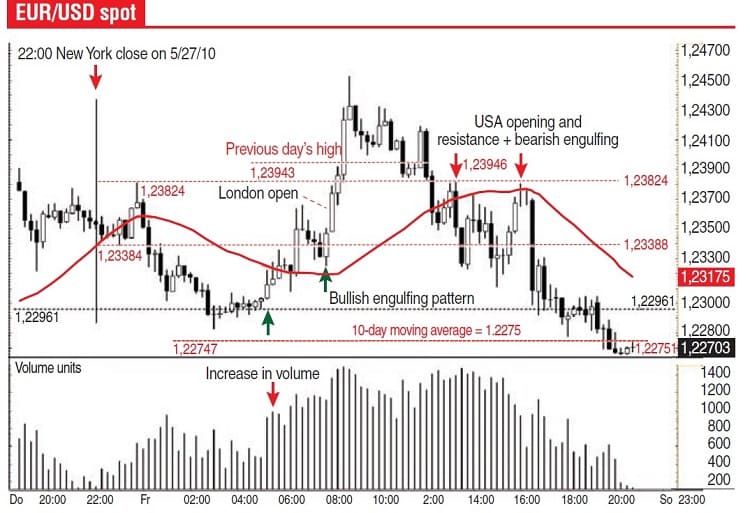
As you see, there is enough information now on the 15-minute chart to enable you to form an opinion about market direction and potential price targets (Figure 4). This is, of course, a trading strategy. Being a 24-hour market, the forex market will see different traders at different times, but for this example, you have a bullish bias during the London session. The entry level is at 1.2338, which is the low of the opening range, with a target at the other end of the range, which is at 1.2382.
Turning to the five-minute chart, three distinct levels stand out: 1.2296, 1.2338, and 1.2382. These levels are, of course, the pivot low from the daily candlestick and the high/low of the opening range. The 34-minute moving average on the five-minute chart acts as a support level for the market after it returns to the opening range but acts as resistance later in the day when the market goes back down through the opening range.
PUTTING IT ALL TOGETHER
Your bias to be long from the daily chart is confirmed by the short-term chart during the European trading session. Do you see how many short-term trades there are just by applying the techniques discussed? What is particularly striking about this type of chart trading is that you can apply very good risk management. A 10-pip stop-loss of each significant level would have kept you going if you had traded off the opening range, the pivot level, or the short-term five-minute simple moving average. Obviously, there is a certain amount of discretion that each trader needs to apply — that is, waiting until the price reaches a level and within minutes applying a short or long trade with a predetermined stop-loss. This makes for a relatively easy trade decision. The technical setup, however, allows you to create a plan for your trades, which is basically a strategy for each trade because it not only includes price targets but also good risk management if the trade goes wrong.
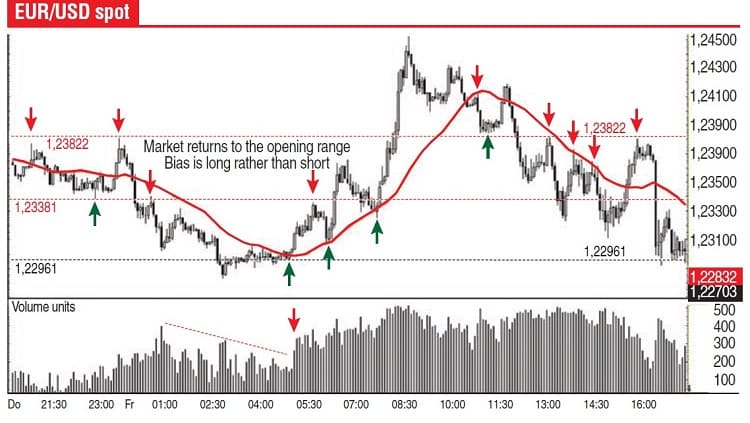
The arrows on Figure 5 depict opportunities derived from the technical setup I have laid out. The arrows are pointing to technical opportunities that appear over and over again. How you deal with them as a trader creates a fine line between success and failure in trading. With that in mind, it would be wise to backtest and demo the setup before trading real money. It is also a good idea to paper trade for the first few hours of the day to get a feel for the technical setup and the market. It will also give you confidence as you begin to see how often you can be right with this method of timing your trades. The strategy will guide you and help you with your trading. The challenge is to control your trades well.
Gareth Burgess has more than 10 years’ experience in applying chart techniques to investment analysis, creating technical views and strategies for corporate-level clients, and is a dedicated private investor. He is founder of the Chart Workshop (www.chart-workshop.de), a provider of technical views for investors.
I’m still learning from you, but I’m making my way to the top as well. I absolutely love reading all that is posted on your site.Keep the posts coming. I liked it!