Trading Articles
Live Cattle Futures: Heliocentric & Sidereal Timing Framework
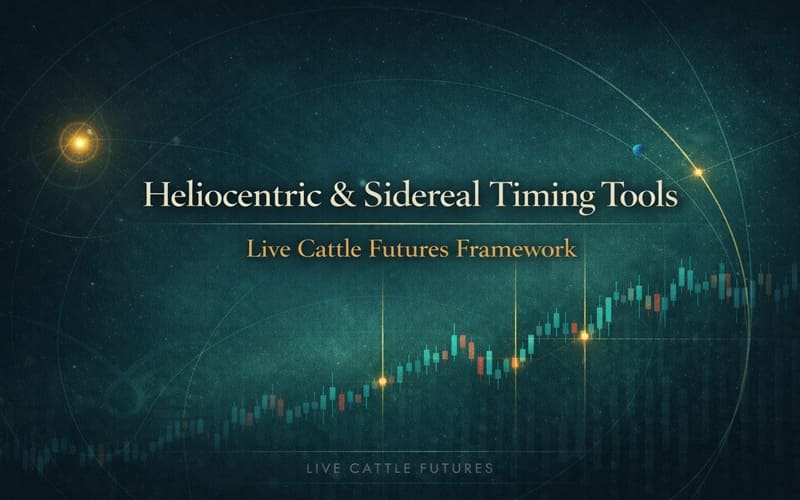
Live Cattle futures are one of the most difficult markets to trade. Bruce Babcock, who has done extensive testing of mechanical trading systems, has noted how few of them respond successfully to cattle data. What is the secret of this ancient market that has been an interest of traders since time immemorial? This article will attempt to suggest trading techniques combining heliocentric astrology, sidereal or Indian astrology, cyclical timing, and traditional technical analysis to improve your live cattle trading score.
Heliocentric and Sidereal Astrology
Heliocentric astrology and sidereal astrology can give additional insights into planetary strength, interaction, and ultimately trend changes and price movements. A quick overview of Indian sidereal astrology and how it can be used follows. Many Western financial astrologers use change of signs as an indicator for change of directions. The Indian system allows for a more microscopic examination of planetary transits by subdividing the zodiac into 27 fixed stars, each of which have four sections creating a total of 108 divisions. The first major difference between Indian and Western astrology lies in the calculation of the longitude of the planets.
Ancient Indian astrologers observed that the equinoxes and solstices moved backward by one degree every 72 years, an astronomical phenomenon now known as precession. Over time this has resulted in a difference of slightly over 23 degrees between the tropical Zodiac, used by Western astrologers, and the sidereal Zodiac, used by Indian astrologers. In essence, the two systems differ in their choice of a zero point for Aries–the Western system uses the position of the spring equinox, while the Indian system uses a fixed star.
Thus when the Sun is moving into Aries according to the Western system, it is still at 6 degrees Pisces in the Indian system. Practitioners of both Indian and Western astrology recognize that each system has its own validity, since both work. My personal preference for the value of the Indian system will become clearer below. The ancient Indian text, the Brihat Samhita, informs us that the sign of Taurus is the ruling sign of cattle. This should be no shock to Western astrologers and their love of Taurus the bull. The planet Venus, is the ruler of Taurus, and is the first key to understanding cattle prices.
Since most commodities are ruled by more than one planet, what other planets should be used? If we run a sidereal natal chart from the first trade of cattle futures in 1964, we get Sagittarius rising, which is ruled by Jupiter. This is further born out by Indian astrological sources that note that the latter half of Sagittarius and the first half of Capricorn govern animals. The third planetary influence is also derived from ancient Indian sources, which associate one of the ancient Indian gods, Lord Shiva, with cattle. Shiva is also associated with the planet Saturn, which is also associated with the sign of Capricorn. Thus in looking at cattle futures astrologically, we must consider the planets Venus, Jupiter, and Saturn.
There are many ways to use Indian sidereal astrology to gain deeper insights into market behavior. Looking at the 1/9 subdivision of each sign of the zodiac is one way. From another microscopic perspective, dividing each of the 12 signs into 9 sections of 3 degrees and 20 minutes creates the same result; these are called NAVAMSHAS. Each of these subdivisions corresponds to a sign of the Zodiac. For example, the first 3ø20′ of Leo is the Aries subdivision, followed by the Taurus subdivision followed by the Gemini section etc.
Advanced Books and Courses on Astro Trading & Esoteric Methods

In watching daily market strengths for over 24 months, I have observed that on days when a planet enters certain critical subdivisions, it will exert more strength or weakness depending on the financial context. So when Venus, the planet with the most impact on cattle prices, enters the Taurus, Libra, or Pisces subdivisions of a sign, one is more likely to see sharper rises in prices if the trend and context are ripe. Whereas, if Venus is debilitated in the Virgo section of a sign, we are more likely to see lower prices or a sharp fall depending on the context. This is one way the Indian system can fine tune calls by providing more detailed daily information on planetary strengths.
Heliocentric astrology is based planetary positions as viewed from the Sun. Its aspects occur at different times from geocentric one. In conducting my research, I have found that heliocentric aspects between Venus, Jupiter, and Saturn are more useful for finding important turning points than are geocentric ones. (Note: A heliocentric ephemeris and list of aspects is conveniently provided in this almanac).
Heliocentric aspects between Venus and other planet except the moon seem to be important for major or minor turns while aspects between Venus, Jupiter, and Saturn are often more major turns. Finally, traditional linear cycles work rather well in the cattle market and can be used as additional tools to gain confirmation of a low or a high. On a daily level, from trading day low to trading day low, watch the 15-, 20-, and 27-trading day cycle. From high to high, watch the 34-, 28-, and 24-trading day cycle. Use multiples of these cycles from major weekly and daily chart turns. Because cattle turns will vary due to the contract month, use the front month and the continuation chart highs and lows for your data.
TECHNICAL TOOLS
When cattle trend, they tend to move in very definable channels. Simply, drawing a line from high to high and from low to low will project future highs or lows. This is especially useful if you know where the cycle ends and time changes. You can project the final price if you know when a major turn is due. Also note, intraday, depending where they open, cattle will often tend to create a range within the channel. So, if one wants to buy the market, look to enter at the lower end of the channel above the previous day’s low.
Stochastics, are also other useful technical tools for trading cattle. For example, if the trend is up, and cattle are bottoming on the 60-minute stochastic, and you have 1-3 time signals of a change of trend, then you can feel more comfortable taking a position if you have a major or minor heliocentric aspect that day.
SUMMARY
In addition to your technical arsenal of trendlines, Gann Squares, Elliott Wave counts, stochastics, RSI, etc., use the following planetary information for entering and exiting cattle trades at key support and resistance levels. In using the information below, keep the market’s context and major trend in mind by examining monthly and weekly charts. The influences below will not be as strong in a bull market as in a bear market.
1) Create a CHART OF TIME CLUSTERS 3, 6, or 12 months. Note the following:
- a) Use major heliocentric aspects (see heliocentric ephemeris) i.e. conjunction, square, trine and opposition between Venus, Jupiter, and Saturn and any planet (besides the moon) to pinpoint MINOR turns.
- b) Use major heliocentric aspects (see heliocentric ephemeris) between Venus, Jupiter, and Saturn and any planet such as the conjunction, square (clockwise only), trine and opposition to pinpoint MAJOR turns.
Note: Indian astrology does not consider sextile aspects except between Saturn and other planets to be important. - c) Do the same for GEOCENTRIC ASPECTS; however, give them secondary significance. Geocentric aspects between Jupiter, Venus and Saturn may be the only ones worth noting.
- e) Count and note 15-, 20-, and 27-trading days from previous major lows. For longer time periods, consider multiples of these numbers. For example, Oct. 23, 1991 was 54 (27 times 2) trading days from the August 8, 1991 low. Use the continuation chart dates for major weekly lows and highs.
- f) Count and note 34-, 28-, 24-trading days from previous major highs. For longer periods of time, consider multiples of these numbers.
To find periods of strength in the market examine the following: - g) Use a sidereal Indian emphemeris or Indian software program to chart transits of Venus, Jupiter, and Saturn–especially on the microscopic level. Note places where Venus is strong on the microscopic level (i.e.. Taurus, Libra, and Pisces navamsha OR 1/9TH DIVISION) or weak on the microscopic level (i.e. Virgo navamsha). (See references below.)
- h) Note that markets often go up on days of the week that are related to their chief ruler. Statistically, note how often cattle go up or at least sideways on Friday (Venus’s day) if the ruler of the day is unafflicted.
2. Circle and underscore time clusters–places where cyclical dates and astrological dates coincide.
3. Combine astrology with technicals. Consider:
- a) What is the major trend on the weekly chart? The daily chart? The 60-minute chart? Examine stochastics. Try to line up all three to trade in the direction of the trend or at least the daily and 60-minute charts should line up.
- b) Look for channel line as discussed above if market is trending. Try to buy or sell at the top or bottom of the channel.
- c) Since the cattle market’s price structure responds especially well to Fibonacci retracements and projections, use rations of .382, .500 and .618 to help determine price.
- d) Use what other technical tools such as Elliott Wave, Andrews Lines or Gann to give you additional information.
PRACTICAL EXAMPLE
- Friday, Oct. 18: Heliocentric Venus square Jupiter
- Saturday, Oct. 19: Geocentric Venus trine Uranus
- Oct. 21-23: Venus in Virgo Navamsha (Sidereal Leo 16.40-20.00)[WEAK]
- Oct. 24: Helio Venus trine Neptune.
- Oct. 24-26: Venus in Libra Navamsha (Sidereal Leo 20.00-23.20–STRONG)
COMMENTARY: Note how two important aspects occur into a weekend and are followed by three days when Venus is weak. Technically, on FRIDAY (statistically an up day), the 60-minute chart was overbought on the stochastics and indicated RSI divergence on a triple top in the 76.90 region. Selling market on close and placing a stop above the old highs and looking to exit on Wednesday when the weak period ended. Result: Market made a high of 76.90 on Friday and fell to 75.60 into Wednesday. Exit Wednesday, October 23 (close) and go long as period of strength for Venus carries into at least October 25.
The above information will be useful for daily trading and holding for daily chart highs and lows. Timing major weekly highs and lows needs more attention with weekly and monthly cycles in coordination with many of the above techniques.
Anyone attempting to uncover the mysterious laws of nature that underlie the commodity markets will be rewarded and intrigued by the depths of Indian and heliocentric astrology. The study of astrology leads not only to knowledge of economic laws, but ultimately to knowledge of the self and man’s relationship to the cosmos. From the Indian point of view, both are One and can be known from our own consciousness.
Excellent article, thank you 🦄