Trading Articles
Support and Resistance Axioms By David G. Ondercin
Here are seven axioms for the practical application of support and resistance levels to your trading. Support and resistance are of central importance to all traders and a necessary starting point for new traders. There are self-evident truths concerning support and resistance of financial markets, so let us examine some of these axioms for their practical application to trading.
AXIOM 1: The concept of support and resistance is important because traders believe it is important.
The belief is self-fulfilling. Traders are certain, for example, that the violation of an established high means that the security will likely go higher. Likewise, when a significant low has been penetrated, traders believe that the market in question will go lower. They hold these beliefs because it happens over and over again. Traders act on their beliefs about how the market moves. Therefore, when they see that the market is bouncing off support, others with the same belief will join in and buy that particular market. That sends the market in an upward direction.
AXIOM 2: The longer the time frame, the more significant the support and resistance level.
Common time frames are:
- Five-minute
- 15-minute
- 60-minute
- Daily
- Weekly
- Monthly
Support and resistance levels take on greater importance with longer time frames. Financial markets can be visualized like a funnel: the higher you go, the wider the funnel becomes. Fewer people are trading one-minute charts compared to those trading a longer time frame. If you are daytrading a five-minute chart and the tradable is approaching a support level, and your 15-and 60-minute charts also show that this same level is an important support level, you may have an entry at that level if support is broken. If that support is broken, that security could plummet for a very nice profit on all three charts. This occurs because you have all the combined traders of the five-, 15-, and 60-minute charts watching and acting upon that price action, not just the five-minute chart traders.
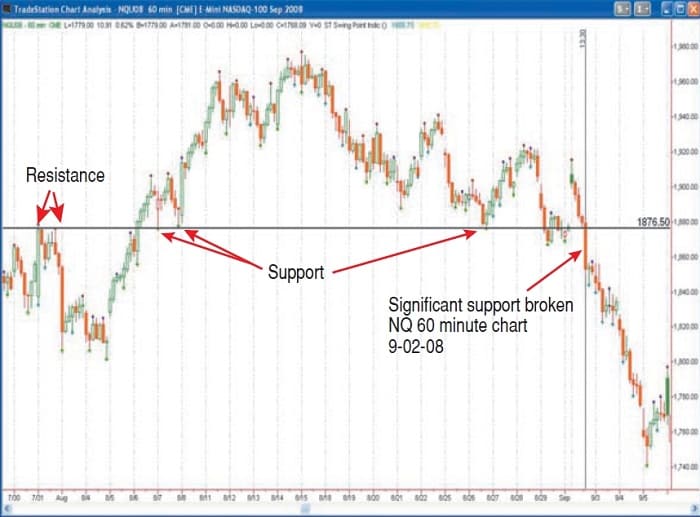
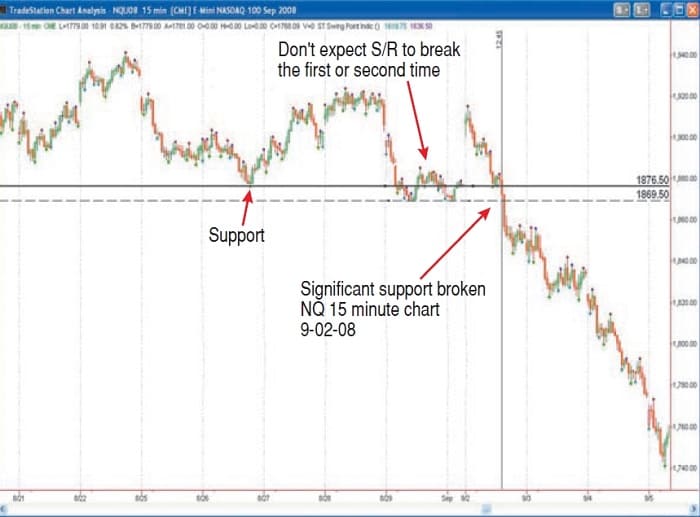
Three charts — the 60-, 15-, and five-minute charts of the NASDAQ (NQ) emini contract — show trade entry when all three charts break support at the same time. The 60-minute chart (Figure 1) shows the NQ holding support until it was penetrated on August 29, 2008, followed by a pullback on September 2, when it smashed through. At the same time, the 15-minute NQ chart shows more detail (Figure 2). The market held at 1869.50 and closed at 1877, or two ticks above significant support.
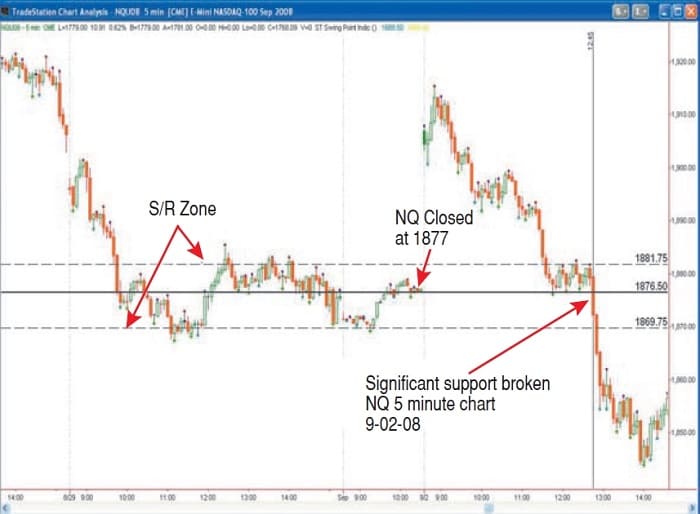
The five-minute chart (Figure 3) shows greater detail. A S&R zone formed between 1881.75 and 1869.75. On September 2, 2008, the NQ came down to significant support (1876.50) on all three charts, hesitated for almost an hour, and then plunged south, breaking support. Observe these multi–time frame violations on your charts until you are comfortable enough to trade them. Remember to always place a stop-loss order after you are filled.
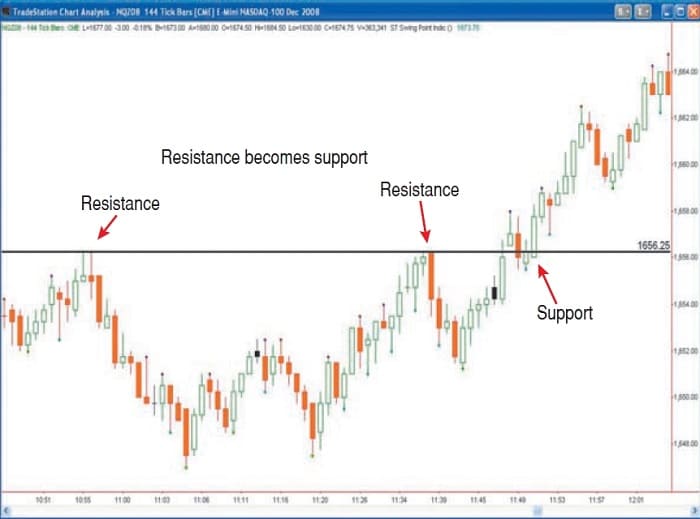
AXIOM 3: Resistance can become support and support can become resistance.
While this is a hackneyed statement, it happens to be a useful trading device. Some traders will use the technique of waiting until resistance becomes support and then enter a long position. The NASDAQ 100 emini chart in Figure 4 shows two points of resistance identified by the horizontal line. On previous occasions, price could only be pushed that high. Once price closes above resistance, that level becomes support. In terms of dollars and cents, that means you can buy with confidence when the security closes above the former resistance line. Figure 4 shows that you would have to take some heat on the pullback, but the direction is clear. Conservative traders like to use the tactic of waiting for the second close above resistance before entering.
Violations of support and resistance on multiple time frames are a powerful tool that you can put to your trading advantage.
AXIOM 4: Support and resistance more accurately describes price zones rather than exact prices.
It would be easier if support and resistance were simply a single price point. You will find that S&R price points are more common on faster time charts. If you are trading tick or volume charts — say, 55 ticks —then you will more likely find yourself trading single price points of S&R. However, longer time frames tend to produce price zones instead of price points. Markets overshoot because stops are triggered by traders interested in taking the market in the opposite direction, and exact price points get blurred over time.
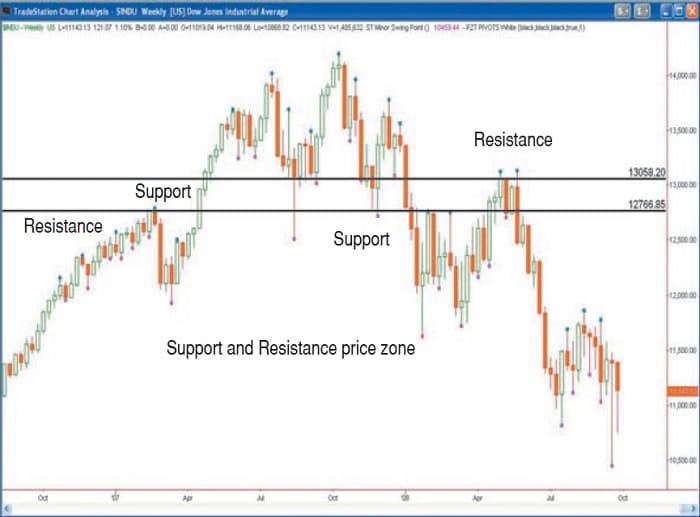
The weekly chart of the Dow Jones Industrial Average (DJIA) in Figure 5 illustrates the concept of a price zone. The point of this DJIA weekly chart is to show the zone of support and resistance. Resistance has become support at two levels. This market pierces the price points of 13,058 and 12,766. Traders tend to remember price levels. Newer traders would do well to take in the lessons afforded by this example; namely, when significant support or resistance is violated, the market will travel beyond the S&R level for a handsome profit. Buy the breakout of resistance and sell short the breakdown of support.
AXIOM 5: You can draw your horizontal lines of support and resistance at the swing highs, the swing lows, or the opens and closes of price bars or candlesticks.
Price bars provide four pieces of price data: open, high, low, and close (OHLC). So where do you draw your horizontal S&R lines? You may choose to start with the swing highs and swing lows because they are the easiest points to identify. Swing highs and lows identify the extremes of support and resistance. The support and resistance price zone chart shows that horizontal S&R lines touch all four datapoints (OHLC) over time. I do not believe it matters that much which price data you select.
Suggested Books and Courses About Chart Patterns
AXIOM 6: Place your order to buy after price closes above the resistance level, or place your order to sell short after price closes below the support level.
This axiom will generate as much controversy as any of the six other axioms. I trade using 144 tick charts and found out that over a large number of trades, if I don’t wait for the bar close, I am going to be stopped out many more times than I am comfortable with. For example, what may look like a sure breakout long position can end up as a gravestone doji (all upper wick and no body). The doji candlestick signals a reversal, and you will likely find yourself stopped out.
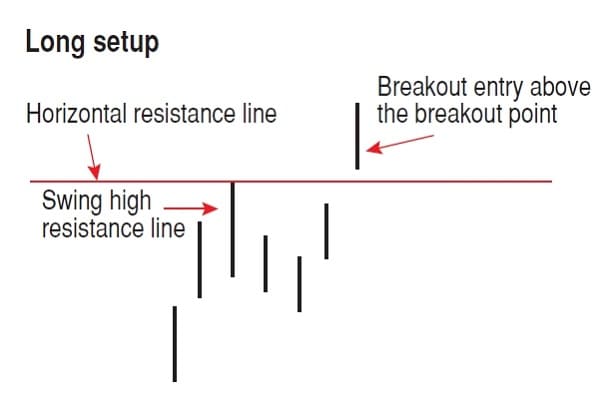
An alternative entry is to enter one or two ticks above the resistance line, typically a high. The swing high is the signal bar, and the entry is triggered when the swing high is taken out by one or two ticks. This entry does not require the bar to close above the swing high bar. This entry is predicated on the belief that poking through the swing high will be rewarded by the bar(s) following through for a profit (Figure 6). Reverse the process for a short entry.
You need to remember that buying or shorting violations of S&R is a breakout/breakdown strategy. Normally, traders will have additional filters in place before executing a trade. Examining the array of possible filters is beyond the scope of this article.
AXIOM 7: Paying attention to significant zones of support and resistance and acting appropriately will improve your odds of successful trading.
When you think about it, trading with the use of S&R is really setting up an “if-then” hypothesis. For example, if price closes above a given resistance level, there is a better than 50% probability that price will move higher. Violations of S&R on multiple time frames are a powerful tool that you can put to your trading advantage. Trading S&R violations does not require you to spend an additional $1,000 on the newest indicator. Even the most rudimentary trading platform lets you snap horizontal lines on a chart.
If you have been spending time and money trying to trade strategies that do not take into consideration significant points and zones of support and resistance, then I encourage you to spend time examining the same charts on which you have been losing money, then draw your S&R lines at critical chart levels and see where you should have entered. You will find some nice surprises that you can apply to your trading.
David G. Ondercin is a full-time emini futures daytrader and owner of Serenity Trading Associates. After 20 years as a college administrator and professor, he left higher education to trade stocks and options. In 1995, he collaborated with his son, John, in the development of a highly successful stock options course. More about David Ondercin and his daytrading methods can be found at his website, MakeMeAGreatTrader.com.
The excellent and duly message.