Trading Articles
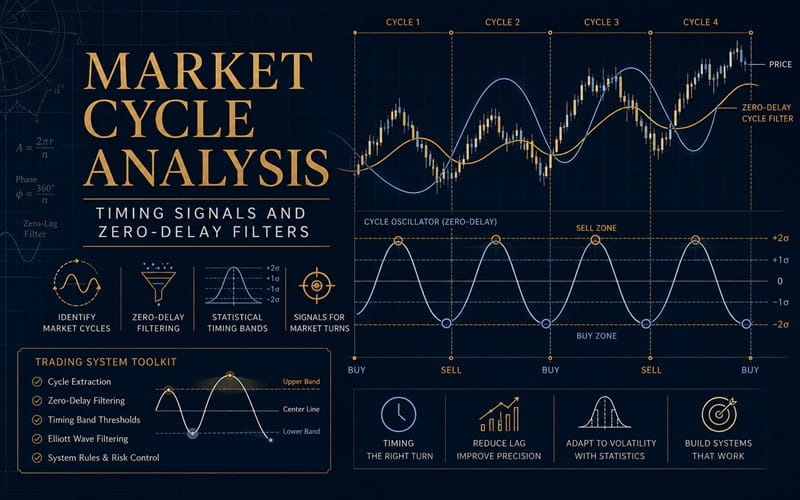
Market Cycle Analysis: Timing Signals and Zero-Delay Filters
Cycles have fascinated traders for decades. This magazine frequently carries articles describing vanous cycles, especially astro-cycles. But if cycles are so clear and obvious, why don’t cycle followers own everything? Maybe cycle aren’t as simple as they seem. Let’s take a look at cycles, and some new technology for trading them.
Ideal Cycle
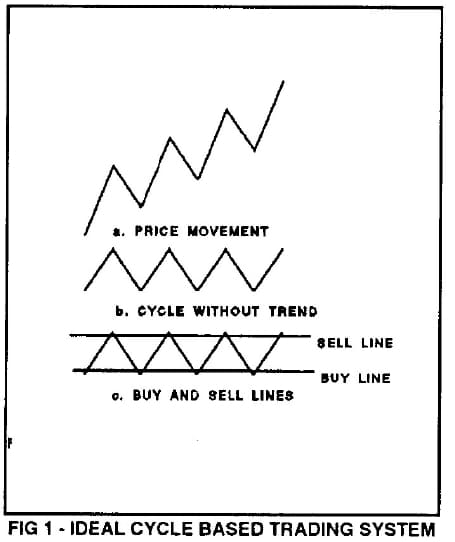
Figure 1, part A, shows an ideal cycle, such as might be found in a stock or commodity. It moves up and down between highs and lows. This cycle may be riding on top of an underlying trend, as shown. Now suppose we could extract the cycle without the trend, as in part B. If we then could measure how high the tops or bottoms were, we would know when this cycle was about to turn up (a buy) or turn down (a sell). If we marked high and low levels, we could call them buy and sell lines, as shown in part C. We could then use two very simple rules to guide our trading.
- When the cycle goes above the sell line, and then comes back down through it, sell.
- When the cycle goes below the sell line, and then come back up through it, buy.
If we could really do this in real markets, trading would be easy, fun, and very profitable. Wouldn’t that be nice? Past Technology. Probably the most widely used cycle technique is the moving average. Many traders rely on regular or exponential moving averages for trading signals. Hurst, in his landmark book, The Profit Magic of Stock Transaction Timing, clearly explains that moving averages are really low pass filters, which can be used to extract cycles from stocks or commodities. He also points out the BIG problem with moving average techniques – the answer they give is valid one-half span ago. For example, when a 200-day moving average computed today turns down, it is really saying that the 200-day cycle turned down 100 days ago. That’s great to know, but not very useful for trading.
 This delay property is characteristic of all “digital filter” cycle extraction techniques. For years I have experimented with algorithms which might overcome this problem. Finally, I have found one.
A New Technology
This new algorithm extracts cycles without delay. It can tell you today that the 200 day cycle turned down – TODAY While the algorithm is proprietary, I am making it available to other traders through a software package called the Trading System Toolkit. Now let’s see how close the Zero-Delay (ZD) filter comes to our idealized cycle model.
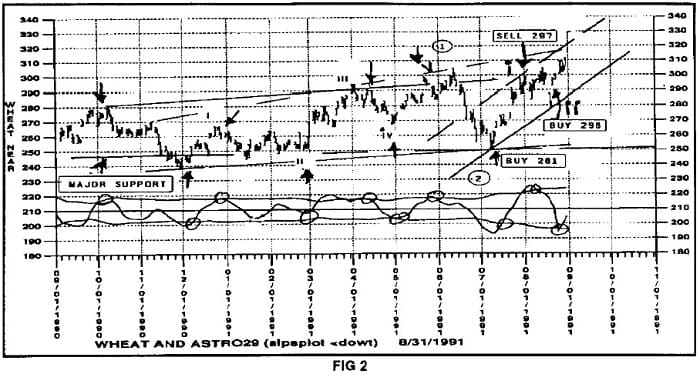
It comes pretty close. It has stood the test of real time use in real markets. It has worked on all markets tried, because they all follow cycles. Figure 2 shows a real example using wheat. A cycle of approximately 29 days is extracted using a ZD filter. Note that this cycle does not behave perfectly. The highs and lows are not always the same level. Also, note that the time between turns is not always 29 days, or even the same. Real market cycles behave this way. They do so because they are the result of many cycles combining.
Now look at the buy and sell lines. They are not level and straight as in the ideal case. The ones shown here are computed using another of my methods. This one computes the statistical distribution of prices over the last 89 days, and then marks a sell line at 1.45 standard deviations and a buy line at -1.45 standard deviations. In this way, the lines account for the volatility of prices. if price action gets slow and sluggish, the lines pinch down. if prices begin to move actively, the lines move apart. In essence, the lines “tune into” the underlying price volatility. Finally, look at the indicated buys and sells. Most of them meet the rules of our ideal system. Price does move up above the sell line, and then back down. It also moves below the buy line, and then back up, giving signals that are near the ideal. A few times, the cycles don’t quite reach the bands, and one might have to make an in-formed guess that the cycle has turned. One can usually trade these situations with a close stop, and do just fine.
The real problem in these non-ideal cases, is that the multiple cycles forming the one we are tracking are somewhat “out of sync” on their timing. Or it could be that the parameters of the system need to be tweeked. Maybe setting the buy and sell bands at +1.4 and -1.4 standard deviations would work better. Or perhaps using just the last 69 days of prices for the statistics would work better. Obviously, it may be both necessary and desirable to adjust the trading system values (called parameters) as time moves along.
Real time use of these ZD based systems has shown two very important things about them. First, it is very easy to come up with a set of parameters that works well over one to two years time. But it has never been possible to come up with a set of parameters which works without adjustment for all time. For example, a 29 day ZD filter is working well with wheat in 1991. When tested on 1972 wheat, it also worked, but a 23 day filter worked much better. There is an absolutely fundamental reason for this. Market cycles are caused by combinations of planetary cycles. The planets form over 7200 major cycles, each with its own period, so in any given year, these cycles change, and their combination changes. This causes price cycles to “slide in and slide out”. They become stronger, and weaker. A particular price cycle will appear to change its length. It may even, due to chaos (another topic for another time ), double its length, or cut its length in half instantly. This is called “frequency jumping”.
The genius of the ZD filter is that it will follow these shifts. It was designed to follow real planetary cycles, yet it uses nothing except price for its input. For example, in the wheat system, the cycle shifted from 36 days between turns to only 22, but the 29 day ZD filter followed this shift nicely. And finally, it does so without delay. No other filter has these capabilities.
Advanced Books and Courses on Market Cycles & Timings


Counting Elliott Waves
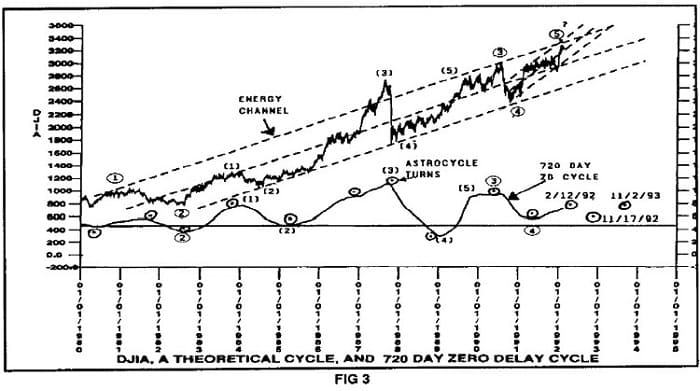
These wave counts are changed so frequently that I call them Chameleon Counts. Using the ZD filter greatly increases one’s ability to count Elliot waves. By applying a filter of a certain length, one seets the degree of the waves to be counted, reducing confusion. While one may still find one or two or three possible wave counts, the probabilities of a valid count which can be profitably traded are much greater. Figure 3 shows an interesting use of a 720 day ZD filter to extract the major waves (cycles) in the Dow. One can easily see that the bull move began in 1980, not 1982. Further work shows this cycle turning on a Mars-Node Astro-cycle. So the ZD filter greatly aids putting all analysis styles together.
Is this tool kit still available, has it been updated to run on windows?
Unfortunately no. But you can use the idea mentioned in the articles for trading.