Trading Articles
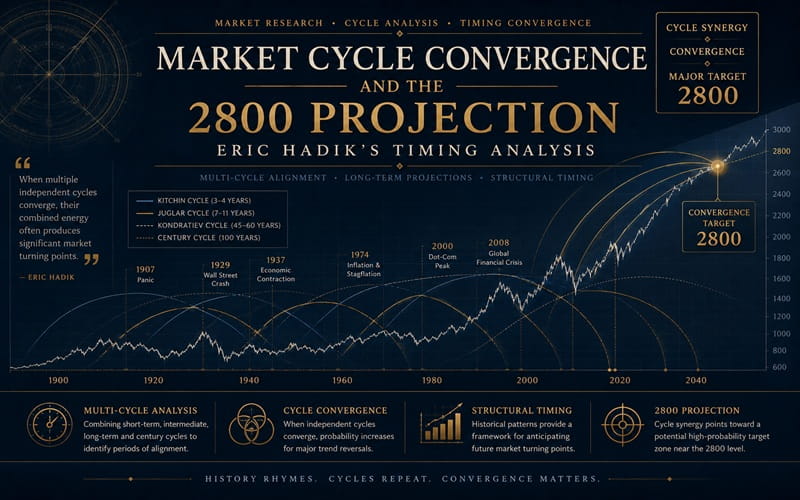
Market Cycle Convergence and the 2800 Projection: Eric Hadik’s Timing Analysis
There are numerous ways to | effectively use, and just as many to flagrantly abuse, the Fibonacci or Golden Ratio. Since a lengthy dissertation on improper utilization of this mathematical phenomenon would serve little purpose, (the P+L column of your account statements will quickly allow you to recognize whether or not you are properly implementing its power and whether or not to seek a better approach) I prefer to concentrate on the benefits, or accentuate the positive utilizations, of this tool. One of the more useful applications of this ratio is within the structure of the Elliott Wave, particularly when comparing known impulse and/or corrective waves attempting to project a subsequent wave or waves. Several examples of this concept are presented in the two preceding articles of this trilogy* and also in most publications on the Elliott Wave.
Relying on a single indicator or use of that indicator, however, can be fatal so a discussion of some additional applications is warranted to avoid the pitfalls of a narrow-minded trader. One of the simplest, and yet most profound methods for utilizing the Golden Ratio is derived from Gann’s principle of calculating the various multiples of significant tops and bottoms as support or resistance for ensuing reversals. Multiplying the six main derivatives of this ratio (.236, .382, .618, 1.618, 2.618 and 4.236) by each of the predominant wave tops and bottoms throughout the preceding sequence, in this case the fifth Cycle wave, and adding the product to that wave renders congruent levels of resistance with one or two of these levels appearing as the most potent. Conforming to the principle of synergy, these levels are most reliable when coinciding wave projections and ratio analyses align, often correlating to Fibonacci Time Projections.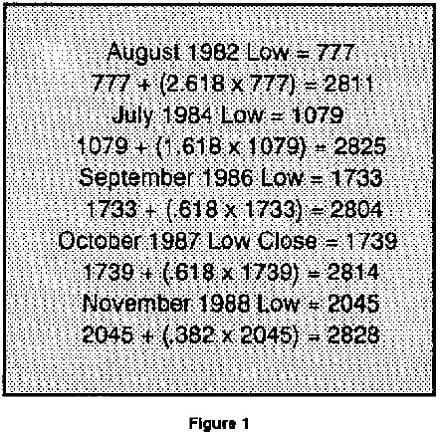
The most significant level of resistance in the Dow Jones Industrial Average is also the most concise, encompassing 24 points and ranging from 2804-2828 and some of the evidence is demonstrated in Figure 1. This level, as originally noted in February 1989, presents an ominous barrier for the DJIA and the likelihood of a penetration through this resistance is relatively small. One final test of 2800 does seem feasible at this point but that would require a 200+ point rally from current levels in the face of what could be a breakdown of the Nikkei Index. (28,000 presents some unique support in this Index coincidentally.)
Advanced Books and Courses on Market Cycles & Timings


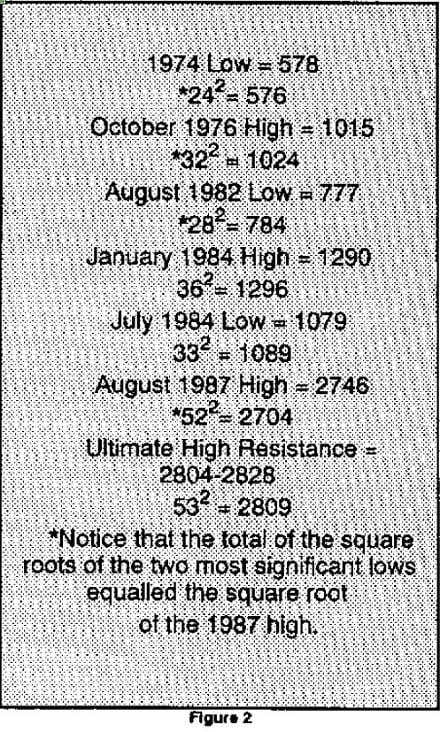
As mentioned in the previous articles, The Fibonacci Ratio can also be applied to cycles and wave longevity to develop time frames when major reversals are probable. It is even more uncanny when other analyses are applied and produce a similar conclusion. Hamilton Bolton, a protege of R.N. Elliott and later A.J. Frost, pioneered the concept of squaring whole numbers as key levels in the market. Each of the highs and lows in the Fifth Cycle Wave have occurred at or very near a squared whole number penetrating these levels only on an intraday or theoretical basis. Incidentally, 2808 is a number, only the fifth up to this point which divides evenly by 9, 12 and 52. (These numbers may ring a bell to Gann students.)
 The strongest argument for a top at 2800, though, is derived from the most credible sources- the works of W.D. Gann and to an even greater extent- The Holy Bible. In W.D. Gann’s 45 Years In Wall Street several guidelines are presented for calculating the normal time and magnitude for impulse and corrective sequences and accepted levels of support and resistance surrounding previous highs and lows.
In Gann’s lifetime, the highest that the Dow had advanced was 386.1. or just shy of 400, and I have used the assumption that this natural level of resistance (natural because it was 1000% of the major lows at 40.56) represents the first multiple for each of his rules and the first full cycle of market action. As the market exceeded this region in the ensuing years and began accelerating in arithmetic terms, Gann’s guidelines should be adjusted proportionately to compensate for the associated stock market prices.
This theory will be the topic for future articles but, presently, it is important to notice that 40 and 400 were the most critical levels in the stock market through most of Gann’s life. When the market finally surpassed 400 in late
1954/early 1955 it never retested this level, let alone penetrating it, further reinforcing its significance. (It is interesting to note that Bob Prechter’s long-term Elliott Wave Forecast calls for a return to 400.) 2800 represents the 7th cycle of market action (or the 70th since the major low at 40) and any Biblical student, or student of life for that matter, should recognize 7 as being the symbol of completion.
All throughout the Bible, one of Gann’s most important guides, the number 7 (and 70) is used to represent culmination, the most noteworthy and predominant examples in Revelation, the final book of the Bible.
When the end times are prophesied in Revelation, the final judgments come in the form of four sevens (coincidentally?) which encompass the seven year tribulation and reign of the Antichrist and culminate the prophetic seventieth week of Daniel. The fourth seven, the final and ultimate culmination and termination of the Gentile world power, is an angel declaring “It Is Finished”. (A unique parallel to the foremost barometer of American economic power–the DJIA)
Reviewing recent action in the Dow Jones, we find that the final rally (fifth Primary wave) into January 3, 1990 commenced at 1616 on October 20, 1987, lasting almost exactly 3-400 pt. cycles. (3 is the other Biblical symbol for completion, particularly when viewing the Trinity.) This high occurred 28 months, and 1 week, after the August 1987 highs and currently I am expecting a 3rd test of 2800 (to mark completion of completion) to occur between April 30-May 4, 1990, ending a 28 week recovery from October 13-16, 1989. If my calculations are correct, a high should occur on March 21 (28 trading days from the recent highs of February 8/9) making April 30 or May 1, 1990 the next 28 day cycle and the likely time for this final top.
For any lingering skeptics of the significance of 7 and 28, consider: Lunar Cycle = 28 days Biological Cycle (Woman’s) = 28 days Human Gestation Period = 280 days (The formation of life) Gestation Period for a Rabbit = 28 days (The basis of the Fibonacci Sequence) Dow Jones Extreme Low = 28.50 (August 8, 1896) …and the low immediately preceding this unprecedented 7 year rally occurred on August 12, 1982 at 777, just 7 points below the square of 28 at 784.