Trading Articles
Gann Square of 144: A T-Bond Price-Time Case Study
In today’s world of high tech hype and costly market systems, the difference between theory and the real market frequently spans a deep gulf of curve-fitting that fails miserably in current and future time. But a mathematical tool developed more than a half a century ago by the master trader W. D. Gann, is still performing in the 1980’s markets exactly as he described that is should. Very early in his career, W. D. Gann perceptively observed a GEOMETRIC relationship between price and time that has been largely ignored both by the old market masters and the new alike, who focus solely on price. When time is a consideration, generally it’s perceived as a sine wave, a cycle apart from price.
Gann’s unique solution was to create clear overlays that were divided into various Price and Time periods such as 360, 90, or 144, and then placed on significant highs and lows on monthly, weekly, and daily bar charts. He used these fixed, geometric figures which he called “MASTER PRICE & TIME CALCULATORS” to measure market strength, weakness and most important of all, the geometric PROPORTION of price movement to TIME. With study, the Calculator can be used effectively on yearly, monthly, weekly, daily and even intraday bar charts. During the depression Mr. Gann charged $5000 for a weekend course of instruction on its use. Today, with a program called GANNTRADER I this powerful tool is available to anyone with a personal computer.
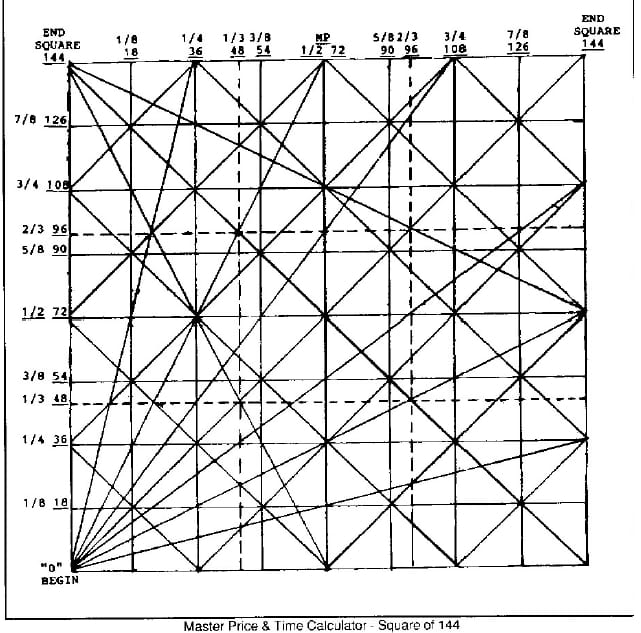
An overview of the schematic of the MASTER PRICE & TIME CALCULATOR shows that the horizontal axis is TIME, the vertical axis, PRICE. The ‘square” (actually a rectangle is divided into eights and thirds in both dimensions. Through years of observation Gann concluded that when prices reached the END of the Square in Time (price & time equal), not only did a change of trend occur but it was frequently accompanied by very strong momentum in the NEW (and opposite) direction. He also observed a change of trend at 1/2 in price and time of the Midpoint, what he called the “Grand Center” of the square. He ranked the divisions of price and time in importance:
- The “End” of the Square the most important; when price and time expire.
- The Midpoint, 1/2 or Grand Center of the Square. If the Square begins at a low, a 2nd higher low often occurs at the Midpoint, 1/2 or Grand Center of the Square. If the Square begins at a low, a 2nd higher low often occurs at the Midpoint or “Grand Center” where all the angles and price divisions converge. If the Square begins at a high, a 2nd lower high often occurs at the midpoint.
- The next divisions in importance for a change of trend are 1/3 and 2/3. These two divisions in price and time often “balance” each other.
- Then 1/4, and finally 1/8. All of the above statements are equally true for PRICE OR TIME. Contrary to common sense, which tells us that markets of today are totally different from those of 20, 40, or 60 years ago, current examples of an idealized Gann ‘Square” working out exactly in real time are not at all unusual. An illustration of one such perfect fit” in the very real world of Interest Rates occurred as recently as March 1987 in the most heavily traded of all future contracts TBONDS. The computer generated chart is a Square of 144, “overlaid” on a Weekly September TBond chart, Gann style i.e. Sep contracts only, in yearly continuation.
Advanced Books and Courses on W.D. Gann Methods


The Square of 144 begins at the bottom of the chart at the last major low in TBonds in June 1984. Just like the schematic, the computer-drawn overlay in divided into eights and thirds vertically and horizontally. Notice that on the 1st 1/8 in Time at 10/5/84, prices had a one week pullback that corresponded exactly with that time division.
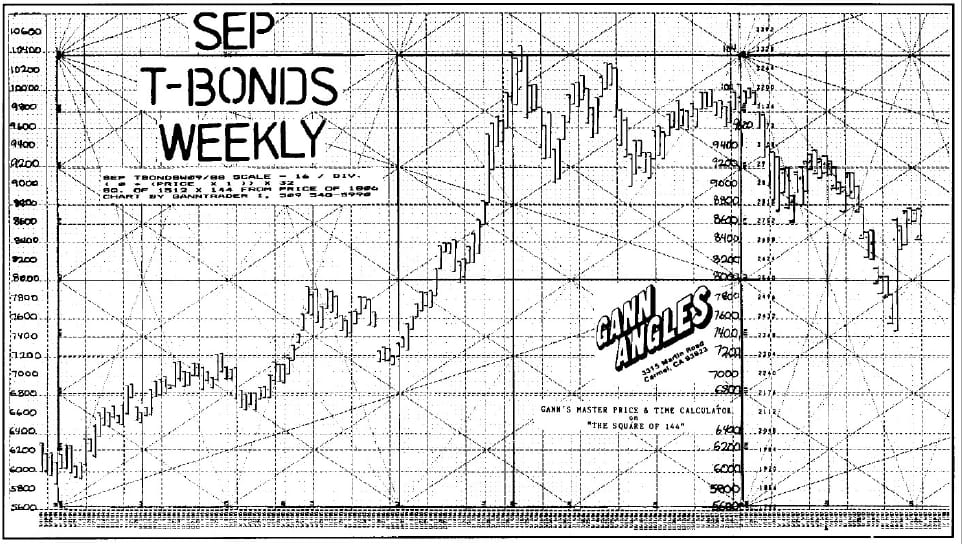
After the low, prices again moved higher stopping exactly (again) at the 1/3 price division at 72 one week before the 1/4 time division was due. At 3/8 in time on the Square, prices almost, but not quite made it up to the 1/2 or Midpoint in price at 80. From there, prices retreated and corrected until one week before the Midpoint or 1/2 in Time was due (10/18/85), another higher low was made. Here is a market on a weekly basis that conformed to Gann’s description: in a rising market a change of trend should occur at the “Grand Center” or Midpoint in the Square. At 71 weeks from the low, one week before the Midpoint in Time, the 7 week downward correction ended and prices continued their strong bull market behavior.
The advance accelerated after the Midpoint low, running prices all the way up to the Top of the Square (strong price resistance) in April 1986 just when the 2/3 Time division was due. That top was also confirmed by another Gann method. The price high at 104 on 4/17/86 was 104 months from the all time high in 1977, making it a Gann “squaring of price & time” on the Sep TBond MONTHLY chart. Although this suggested that a major change of trend could occur in TBonds (from up to down), there was still 48 WEEKS remaining in the Square of 144, the End of Square not due until the week ending 3/6/87.
But it’s easy to see that after that important monthly and weekly high was made in April 86, the advance which had been in progress for 96 weeks (2/3 in sq. of 144) stopped making new highs and became extremely volatile. It had a major drop from 1-4 to 9116, then back to a lower high at 102 in Aug 86, then down again to a lower low at 90 in Sep. 86. As the advance faltered, there were several caution flags during January and February 87. Weekly price ranges began shrinking despite sharp advances in the stock market and of course, the Square of 144 was running out of time. (It had run out of Price at the top of the square in Apr. 86.) The finale of this almost 3 year market saga was staged on March 5, 87 when the Tbonds proved once again the genius of Mr. Gann’s methods by making a 3rd lower top EXACTLY AT THE END OF THE WEEKLY SQUARE OF 144.
The trader in possession of this information was able to anticipate, almost a year in advance, the proper time to short into the top with great confidence as this most heavily traded of all futures conformed to the Square for almost three years. Imagine what this could have meant to the several brokerage houses that lost hundreds of millions of dollars in the momentum declines that followed the “End of the Square.” In March 87, many leading interest rate analysts were “forecasting” prices to 108 or even 110 yet anyone who had this Square knew almost a year earlier that a major trend change was indicted and that patience to wait it out would be well rewarded.
But the value of the Square doesn’t end with the top. The new square is a road map of FUTURE price and time. TBonds have entered the third Square of 144 since the 1981 low. Since trend during the first two squares was decidedly up and bullish, Gann principals suggest that the main trend during this square will be down and bearish. Judging from the 1st decline in April/May 87 that hit the 5/8 price division 8600 by making a low at 8603, followed by the next leg down that met the 3/8 division at 7400, it’s clear that the accuracy of the previous two Squares can be relied upon to continue. As the major price Top was made at 2/3 in Time in the 2nd Square, Gann’s Principals of balance implies that 1/3 into this new Square (2/5/88) should be a major low.
Keep this going please, great job!