Trading Articles
The Practical Application of Gann’s Law of Vibration in Time and Price Forecasting

Now, We will turn from an examination of the general principles of the Law Of Vibration, as discerned from W.D Gann’s interview to the “Ticker And Investment Digest,” to an examination of the key steps in its practical application. These key steps in the practical application of Gann’s Law Of Vibration are as follows.
1. Identify the point in time that marks the start of an uptrend or downtrend. This can be achieved by examining the daily, weekly or monthly price chart of the stock or commodity.
2. Identify the predominant astrological influence (or cycle) driving the uptrend or downtrend. In order to achieve this, it will be necessary to examine previous cycles of the stock or commodity in order to identify which particular astrological influences have driven the stock or commodity in the past. In this task, it will be especially helpful to examine the all-time high and all-time low price of the stock or commodity because at these price extremes the astrological influences will typically be very strong or very weak, respectively. Thus, under the Law Of Vibration, a high price is caused by a high rate of vibration, which in turn is caused by strongly positive astrological influences (and vice versa).
3. Identify the general rate of vibration of the uptrend or downtrend. This can be achieved by placing the origin of the Gann angles (or Gann fan lines) at the starting point (in time and price) of the uptrend or downtrend. In this task, it will be helpful to have prepared a transparent plastic chart overlay inscribed with the major Gann angles (i.e. 1 x 8, 1 x 4, 1 x 2, 1 x 1, 2 x 1, 4 x 1, 8 x 1, etc.) and their subdivisions.
4. Forecast the approximate date when the predominant astrological influence (or cycle) that is driving the uptrend (and was identified in point 2) will end. This can be achieved by consulting an ephemeris and the astrological chart of the start of the uptrend or downtrend.
5. Forecast the future price when the uptrend or downtrend will end. This can be achieved by identifying the intersection of the general rate of vibration of the uptrend or downtrend (point 3) and the forecast date that the uptrend or downtrend will end (point 4).
6. Monitor one’s forecast, which comprises all of the above elements. In particular, note that short-term positive astrological influences will increase the rate of vibration and temporarily drive prices above the long-term rate of vibration (i.e. above the long-term Gann angle identified in point 3). Conversely, note that short-term negative astrological influences will decrease the rate of vibration and temporarily drive prices below the long-term rate of vibration (i.e. below the long-term Gann angle). However, when these short-term influences expire, stock or commodity prices will revert to their long-term rate of vibration (i.e. the long-term Gann angle).
Examples of The Practical Application Of Gann’s Law Of Vibration:
Now, we will examine two examples of the practical application of Gann’s Law Of Vibration, which are provided in his interview to the “Ticker And Investment Digest.”
Example 1: September 1909 Wheat futures contract (please see chart 1).
“One of the most astonishing calculations made by Mr Gann was during last summer (1909) when he predicted that September wheat would sell at $1.20. This meant that it must touch that figure before the end of the month of September. At twelve o’clock, Chicago time, on September 30th (the last day) the option was selling below $1.08 and it looked as though his prediction would not be fulfilled. Mr. Gann said, ‘If it does not touch $1.20 by the close of the market it will prove that there is something wrong with my whole method of calculation. I do not care what the price is now, it must go there.’ It is common history that September wheat surprised the whole country by selling at $1.20 and no higher in the very last hour of the trading, closing at that figure” (Ticker interview).
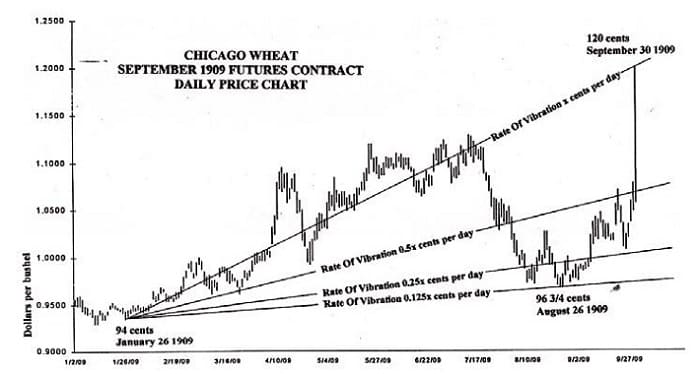 1) Gann identified the start of the uptrend in the September 1909 wheat futures contract as a price of 94 cents on January 26, 1909.
2) Gann identified the predominant astrological influences driving this uptrend.
3) Gann identified the long-term rate of vibration of this uptrend, which was 0.1053 cents per day (or 1 cent per 9.5 days).
4) Gann forecast that the predominant astrological influences driving this uptrend would remain in force until at least the end of this futures contract (i.e. until at least September 30, 1909).
5) Gann forecast that at the end of the futures contract the price would be $1.20. This was based on the starting point of the uptrend (point 1 above), the long-term rate of vibration (point 3) and the contract’s expiry date of September 30, 1909.
6) In monitoring his forecast, Gann observed that since the beginning of the uptrend on January 26, 1909, short-term astrological influences had temporarily driven prices above and below the long-term trend or rate of vibration. Gann also observed that between July 21 and August 26, 1909, stronger short-term negative (or malefic) astrological influences had driven prices down well below the long-term rate of vibration. Moreover, Gann observed that commencing August 26, 1909, (i.e. the low point of 96¾ cents) these strongly negative short-term influences started to expire and he forecast that they would fully expire over the next month, when prices would revert to their earlier long-term rate of vibration.
Advanced Books and Courses on W.D. Gann Methods


Importantly, Gann received corroboration of the low point in August from the fact that a price of 96¾ cents on August 26, 1909, equates to a rate of vibration of 0.0132 cents per day (based on the starting point of 94 cents on January 26, 1909). This rate of vibration is one eighth of the long-term rate of vibration of 0.1053 cents per day. Another perspective is that on August 26, 1909, the long-term rate of vibration of this wheat futures contract had halved three times. Thus, from August 26, 1909, Gann forecast and observed the simultaneous expiration of the short-term negative astrological influences and the doubling three times of the rate of vibration, as the long-term rate of vibration was regained on September 30, 1909.
Example 2:United States Steel stock price (please see chart 2).
He (Mr. Gann) came to me when United States Steel was selling around 50 and said, ‘This Steel will run up to 58 but it will not sell at 59. From there, it should break 16¾ points.’ We sold it short around 58 3/8 with a stop at 59. The highest it went was 58¾. From there it declined to 41¼; -17½ points” (Ticker article).
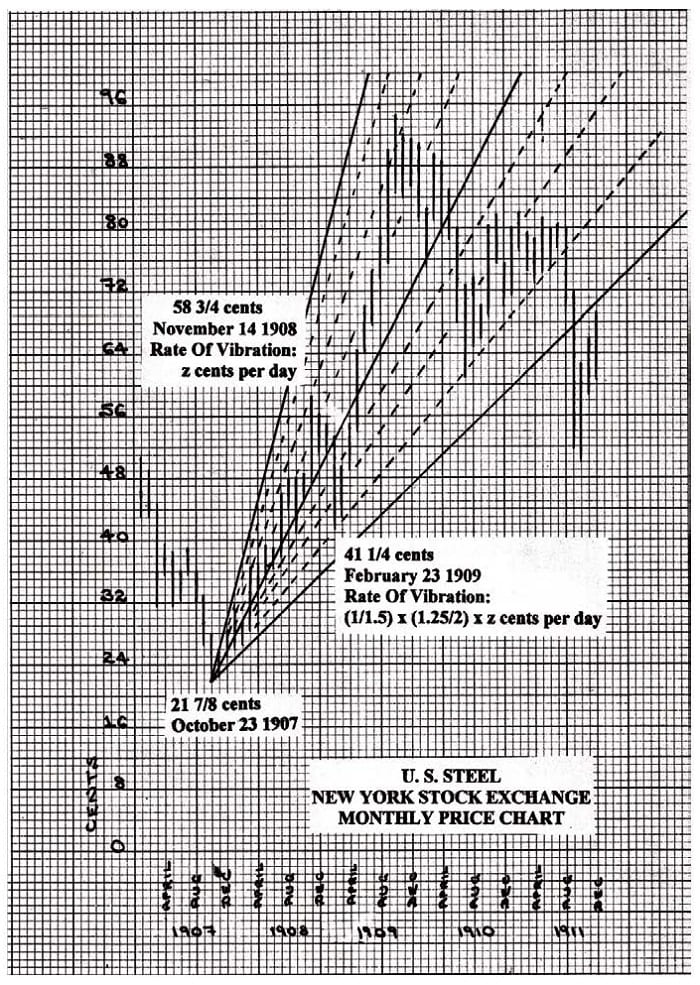 1) Gann identified the start of the uptrend in U.S. Steel as a price of 21-7/8 cents on October 23, 1907.
2) Gann identified the predominant astrological influences driving this uptrend.
3) Gann identified the long-term rate of vibration of this uptrend, which was 0.0950 cents per day (or 1 cent per 10.5 days).
4) Gann forecast that the predominant astrological influences driving this uptrend would remain in force until October 1909, and hence in November 1908 he was only forecasting a short-term correction. More specifically, Gann made his forecast “When United States Steel was selling around 50,” which was in early November 1908. Gann forecast that due to short-term negative astrological influences a correction would start on November 14, 1908 (i.e. within two weeks).
5) Based on the starting point of the uptrend (point 1) and the long-term rate of vibration (point 3) and the starting date of the correction (point 4), Gann was able to forecast that “Steel will run up to 58 but it will not sell at 59.” In fact, the price of U.S. Steel peaked at 58¾ on November 14, 1908.
6) Gann forecast that the short-term negative astrological influences that he had identified would remain in force until February 23, 1909.
7) Gann forecast what the rate of vibration would fall to on February 23, 1909 (i.e which Gann angle would provide support before the long-term uptrend was resumed). Importantly, in making this forecast Gann subdivided the rate of vibration. More specifically, and as the price chart of U.S. Steel shows, Gann forecast that the price of U.S. Steel would fall to the bottom of its current vibratory band and finally fall three quarters of the band below. Thus, Gann forecast that the short-term correction would last until February 23, 1909, and that the rate of vibration of U.S. Steel would fall on that day from its long-term rate of 0.0950 cents per day to (1/1.5) X (1.25/2) X 0.0950 = 0.0396 cents per day. This is in fact exactly what happened. More specifically, on February 23, 1909, U.S. Steel made a low price of 41¼ cents (which based on the starting point of 21 7/8 cents on October 23, 1907, equates to a rate of vibration of 0.0396 cents per day). From that point, the long-term uptrend of U.S. Steel was resumed.
An important point from this example is that Gann did not merely use his so-called Gann angles as a crude measure of the rate of vibration of stocks and commodities. More specifically, he did not use them simply to measure the doubling and halving of the rate of vibration. Rather, he also discovered and employed subshells within a principal energy level, which is analogous to modern quantum theory. Therefore, we have discovered another important principle of Gann’s Law Of Vibration; namely the rate of vibration of stocks and commodities, as measured by so-called Gann angles, conforms to a series of principal energy levels and sub-shells.
As we have seen, an important implication (and practical application) of this is that rates of vibration, as measured by these principal energy levels and sub-shells, constitute support and resistance levels. This clarifies the statement made by Gann: “By knowing the exact vibration of each individual stock, I am able to determine at what point each will receive support and at what point the greatest resistance is to be met” (Ticker interview).
Moreover, this principle in turn sheds light upon a some-what obscure concept that Gann briefly introduced in his stock market course and his commodities course, namely the ‘concept of lost motion:
As there is lost motion in every kind of machinery, so there is lost motion in the stock market due to momentum, which drives a stock slightly above or below a resistance level. The average lost motion is 1 7/8 points. When a stock is very active and advances or declines fast on heavy volume, it will often go from 1 to 1 7/8 points above a halfway point or other strong resistance level and not go 3 points. The same rule applies on a decline. It will often pass an important resistance point by 1 7/8 points but not go 3 full points beyond it. That is why I advise using a stop-loss order 3 points above a top or 3 points below a bottom” (W. D. Gann Stock Market Course, Chapter 10.
In summary, from examining examples of the practical application of Gann’s Law Of Vibration, we have identified three further principles of the Law Of Vibration:
1) The rate of vibration of stocks and commodities conforms to a series of principal energy levels and subshells. More specifically, the principal energy levels equate to a doubling and halving of the rate of vibration and the sub-shells equate to a fourfold division of a principal energy level.
2) These principal energy levels and sub-shells constitute important support and resistance points.
3) When a stock or commodity is very active, momentum will often drive the price very slightly above or below the precise support or resistance point, which is determined by the rate of vibration (in conjunction with astrological influences).
At point 3 – How Gann have calculated rate of vibration? 0.0950 cents per day (or 1 cent per 10.5 days)