Trading Articles
The Declination Trading System: An Astronomical Timing Framework
In the first chapter of book Techniques of an Astro-trader, we went over the basics as far as how the solar system can be represented in an astrologer’s wheel. In addition to having a degree value telling us what part of the sky a planet falls in, we also have a measurement telling us how far above or below the celestial equator the planet is. This is called the declination of a planet. So not only do planets move around us, they also move above and below us in their journey around the Sun.
This vertical up-and-down movement is known to astrologers, but is not commonly used by them, because standard astrological practice tends to focus much more on aspects between various planets, and the houses in which planets fall based on the time of birth. It’s a shame that declinations aren’t taken more seriously, as they are incredibly powerful. There are as many different declinations that can be watched as there are planets. In this chapter, I’m going to focus on a very specific calculation that I’ve found to be very predictive when used to forecast the stock market. The calculation is as follows:
Declination System =
6 x Mercury Declination +
5 x Venus Declination +
4 x Earth Declination +
3 x Mars Declination +
2 x Jupiter Declination+
1 x Saturn Declination
Note that these are heliocentric (sun-centered) declinations! Remember the physical model introduced in.
Chapter 2 that described how the Solar Wind could influence the moods of people on Earth, which in turn would affect their stock portfolios? This particular calculation is based upon that premise, and each planet is weighted according to its distance from the Sun-Mercury is the closest planet to the Sun, and Venus is the second closest. Because of that, and because those two planets can come between the Earth and the Sun, they are given the most weight. They actually account for 95% of the variation in the Declination System, so you could just use them and ignore the other planets if you wanted to. I add them all in because I use a computer that does the hard work for me, and the long-term planets actually do shift things by a day here and there, but if you’re going to be computing this by hand, just use those first two planets and you’ll get the same results.
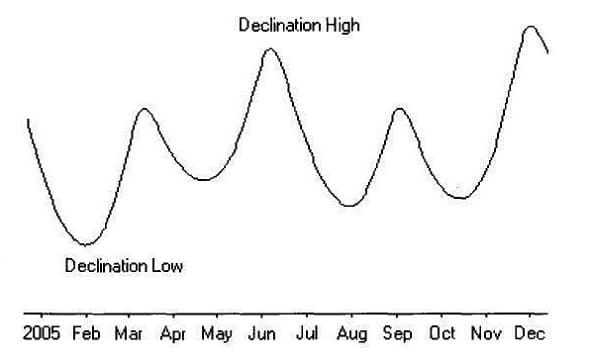
The chart above shows our declination calculation back.
in 2005. When the line makes a low, it means the average declination for all planets in the equation is low, and when it makes a high, it means on average all planets have a high declination. The key points are the peaks and troughs in the curve, when the trend of the declination line changes. Take a look at what happens when we overlay this onto a chart of the Dow Jones Industrial Average for the same time period:
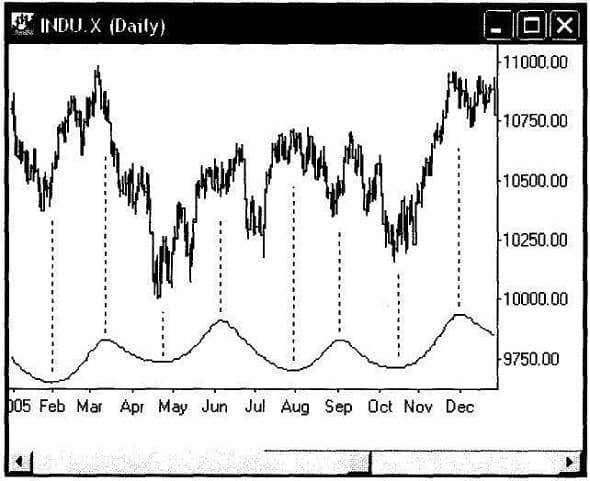
You can see that when the declination curve makes a top or bottom, the stock market responds and also makes a top or bottom. Tops don’t always go with tops, and bottoms don’t always go with bottoms, but the trend changes and the market makes a turning point at that time. So if the market falls into a declination peak or trough, we expect a bottom, and if it rises into one, we expect a top. Let’s zoom into the first half of this chart examine what is happening in detail:
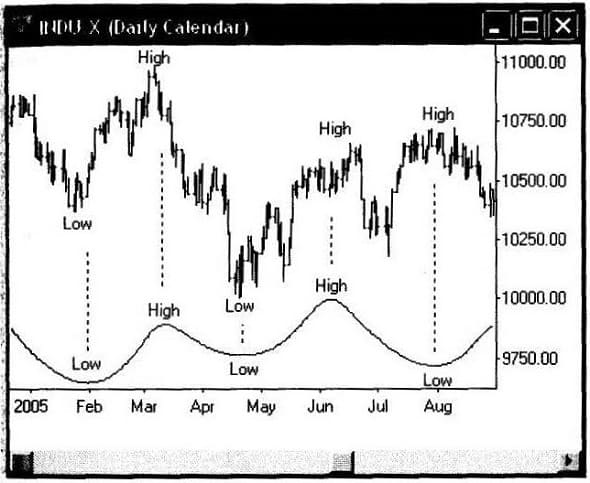
In February, the forecast made a low, and the market made a low. Then the forecast made a high, another low, and a high, all of which correlated perfectly with the market. But the final low on the chart, in August, corresponded with a high in the market instead of a low.
Advanced Books and Courses on Astro Trading


Imagine the declination forecast as being a drummer, pounding out the rhythm that the market will dance to. In the first part of the chart, the market took a step each time the declination played a beat. They were totally in synch. But later in the chart, the market took two steps instead of one, which meant that when the beat came along, the market was now on the opposite foot, and we bad a high instead of a low.
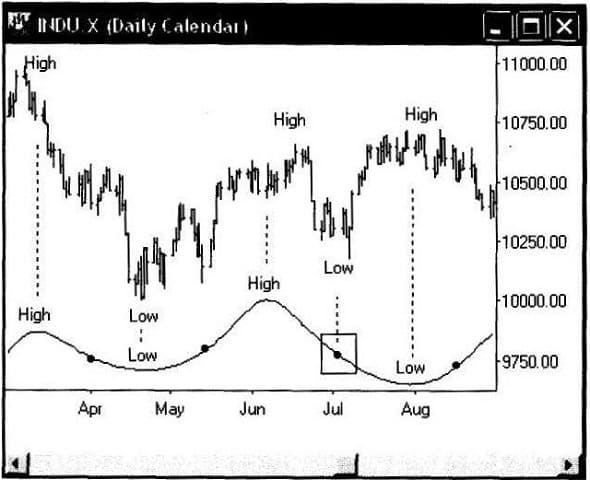
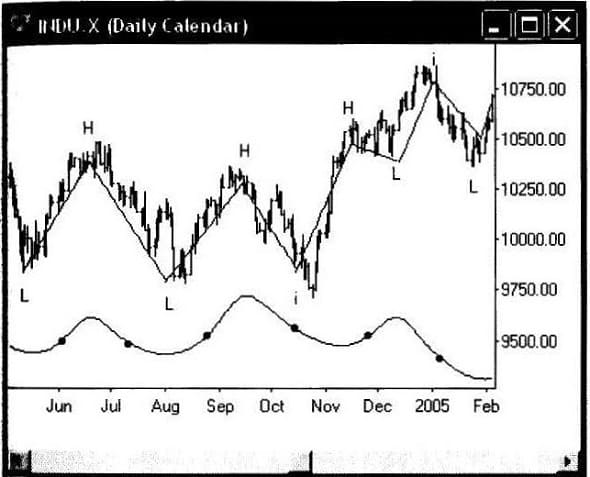
The market is very precise. If you don’t know the dance it is moving to, it seems awfully confusing, but once you know the music, it always takes a step at the correct time. So if it is going to do a double step, it’s going to want to do that at some important point in the rhythm. If you look at the chart above, you can see that the extra step, forming the low in July, happened exactly halfway down the declination cycle. I’ve been talking in terms of drums and dancing, but from a more scientific viewpoint, the market exhibited frequency doubling at this point: one larger wave split into two equally sized smaller waves. You can see that we again had frequency doubling later on that year to get us back into the regular rhythm that we originally started with:
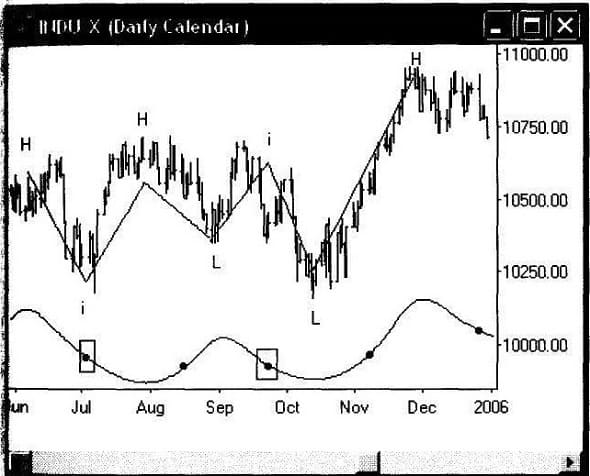
I’ve labeled the swings, and have boxed in the areas where frequency doubling occurred. The one we just studied was the first box, and then the second occurred in September, where the market formed a high at the halfway point to get back onto the beat.
I tend to mark highs with an “H,” lows with an “L,” and halfway turns with an “i.” The “i” stands for “Inversion,” and. represents turns that take place on those halfway dots in the forecast. Inversions are where we experience frequency doubling, and the rule is that the market can only invert at those halfway points. If it doesn’t invert there, then the market won’t be able to change direction until it reaches the next turn in the declination cycle.
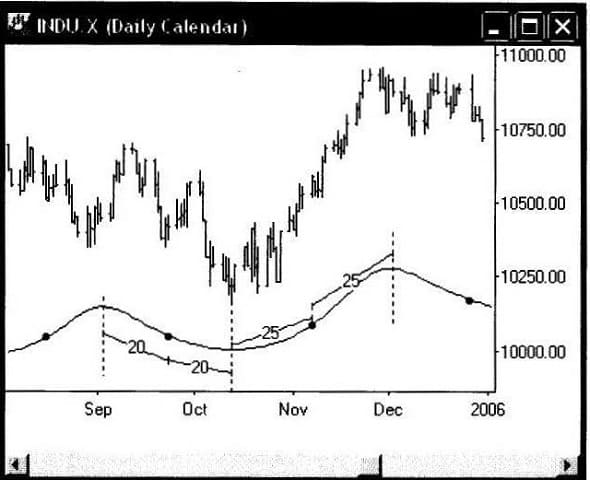
A halfway point is simply the midpoint between two consecutive turns in the declination forecast. To calculate where they fall, simply count the number of days between two turns in the forecast, and go exactly halfway in between. In the downward swing from September to October, the halfway point occurred 20 days into the cycle. The next upswing was a longer one, so the halfway point occurred 25 days into that leg. For ease of application, I’ve programmed the computer to draw dots at all the halfway points. The code to replicate this plot has been included in the appendix at the back of this book.
Let’s go back a bit farther and see how the declination cycle mapped to price leading up into 2005:
2004 was actually a very easy year to trade using this tool. The market followed the declination cycle pretty much 1Pro-for-turn. You can see that we had an inversion form in October, and another one just as the calendar turned over to 2005. Note how the declination cycle doesn’t really say anything about how large a particular move will be. It only tells you the direction and duration of the move. So the downward Cycle in November to December was quite muted compared to other downswings, due to the upward trend that the market was in at the time.
Generally speaking, you can learn a lot about the underlying trend in the market by watching how the declination cycles manifest themselves. If a cycle is having big trouble making headway, it means that it is going against the prevailing trend and odds are that once the cycle finishes, the market should take off in a snappy way the other direction.
In any case, it’s always best to keep an eye on both cycles. Sometimes you have to spend a little time working out the swings, but once you have them, they will provide you with invaluable information about what the trend is doing, how long is will last, and at what points you ought to try and take a position.
Remember that the market really doesn’t like to change direction anywhere except where the forecast permits, so if you’ve done your homework, you’ll know where those points are and will be able to go with the flow from one point to the next. You won’t always be right, and you won’t always see the inversion points coming, but with practice you ought to be able to be right more often than not, and you should be able to come up with some very tradable market forecasts in the process.
The main thing to realize is that all these cycles are known in advance, which means there’s no excuse not to be prepared and ready to expect all possibilities. I can sit down and look at the cycles for the year 2020, and know the dates when the major turning points ought to form in that year. I can then use the smaller cycles to come up with a very specific game plan as to how I’m going to position myself to take advantage of those big turns. Now that you know the beat that the Dow is dancing to, you ought to be able to do the same thing.