Trading Articles
Dynamic Support and Resistance: Volatility and Market Structure
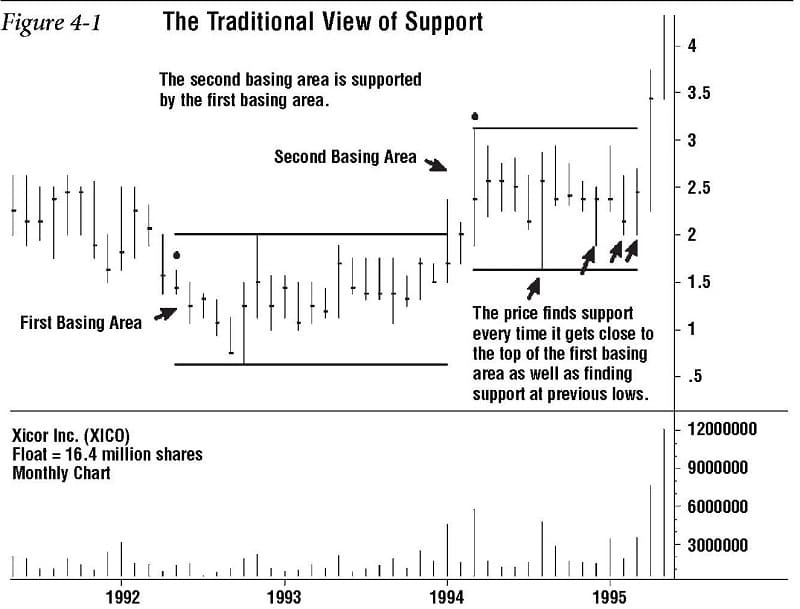
The traditional view of a base of support in technical analysis is a sideways price consolidation area from which prices rise and which also offers support if the price drops back down to it. Xicor (XICO), the stock discussed in detail in book, gives an excellent example of this pattern. Its price went sideways between $1 and $2 for two years and then rose above this area up to the $2 to $3 level. The initial $1 to $2 sideways consolidation area is considered a base of support from which the price rose. Once it has risen to a new level of $2 to $3, it finds support every time it comes back down close to the original basing area. Support also occurs when the price drops near a previous low during the $2 to $3 level (see figure 4-1).
In float analysis, a base of support includes this traditional view but also expands it in a new direction, so that a base of support is a constantly changing phenomenon that rises with a stock’s price. Support then occurs when the float turnover is under the price: Stated another way, a stock’s price is supported when it is rising above its float turnover.
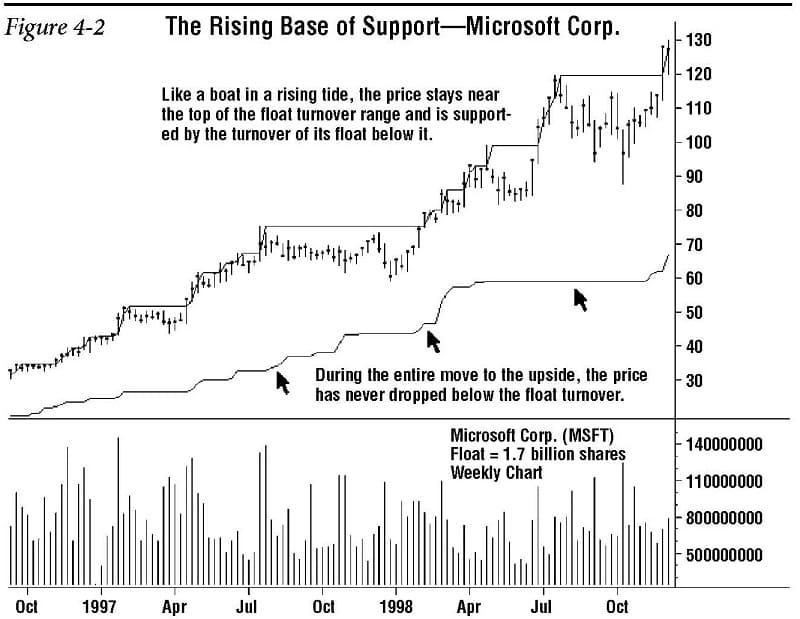
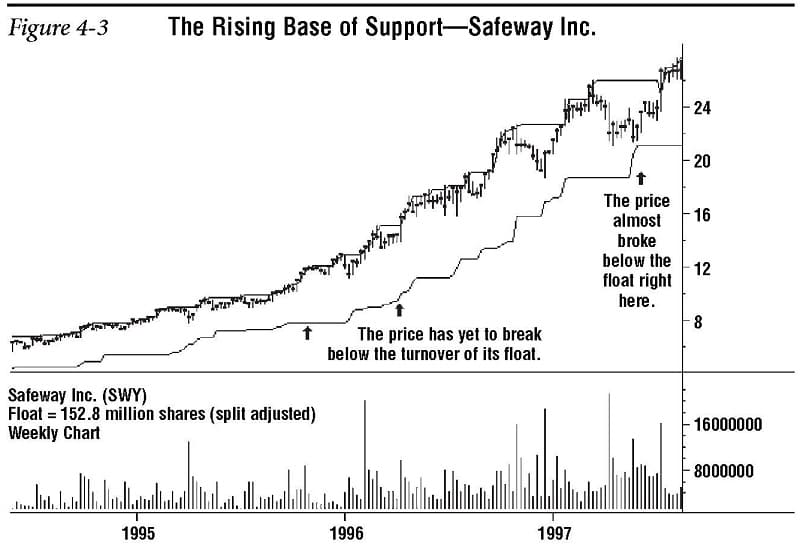
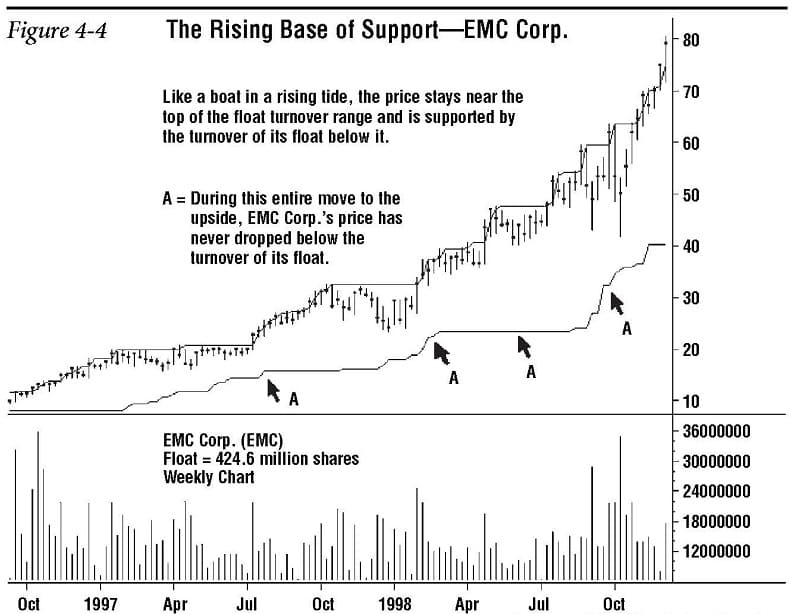
A strong base of support starts as a sideways price consolidation area, but as the price rises, the base of support actually rises with it. More specifically, it rises underneath the price. Thus, when a stock’s price is making a long upward move, the price will seemingly rise above the float. As new buyers bid the stock’s price up, it becomes like a boat in a rising tide. Look at the chart of Microsoft Corp. (MSFT) (see figure 4-2): its price doesn’t drop below its float turnover at any point on the chart, but stays near the top of the float turnover price range during the entire upward move. Other good examples are Safeway (SWY) and EMC Corp. (EMC) (see figures 4-3 and 4-4).
The Descending Ceiling of Resistance
In like manner, the traditional view of an area of resistance is defined as a sideways price consolidation area above a stock’s present price. This congestion area causes resistance to any up-ward move and acts as a ceiling through which prices must struggle. In float analysis, it’s this and more. Here, resistance is having the float turnover above the price.
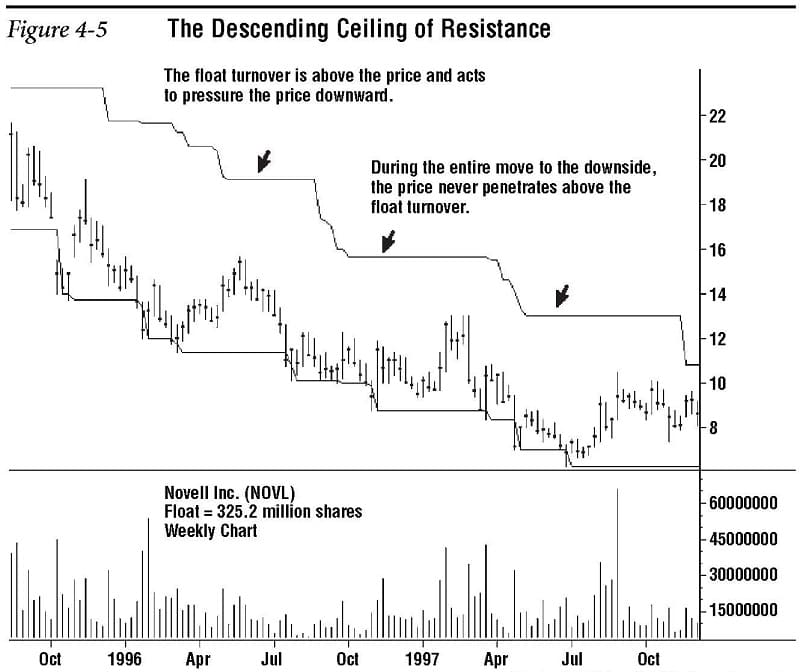
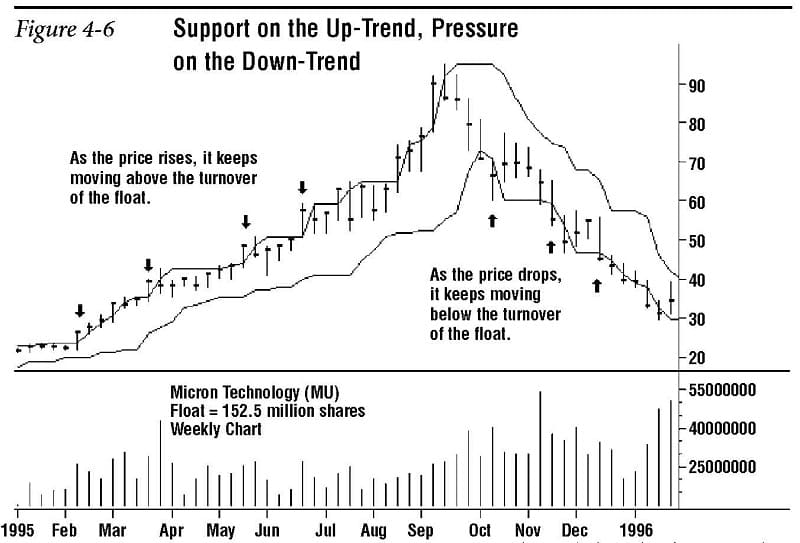
This ceiling of resistance follows descending prices and acts against rising prices throughout a long declining move. The stock’s price is like a boat going downstream with pressure coming from the float turn-over that is above it. Novell (NOVL) (see figure 4-5) is in a long price decline with its float turnover providing pressure from above. Micron Technology (MU) is an excellent example of a stock having support on the way up and being under pressure on the way down (see figure 4-6).
The Changing Nature of Float Turnovers from Support to Resistance, and Vice Versa
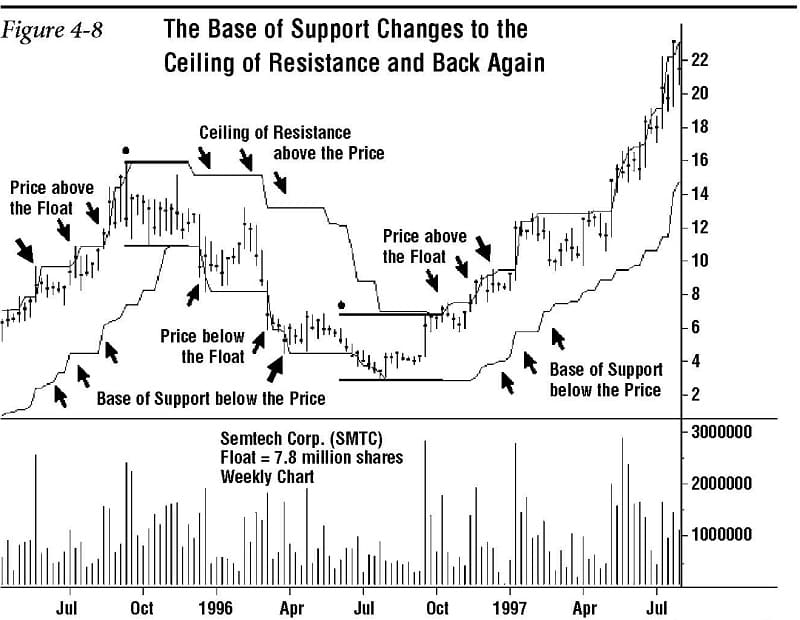
Float turnovers are dynamic and constantly changing. They can move from being a base of support to a ceiling of resistance, and vice versa. Thus, whenever a stock in a long-term price decline turns around and starts heading back up, its float turnover will change from a ceiling of resistance to a base of support.
Advanced Books and Courses on Price Action Trading


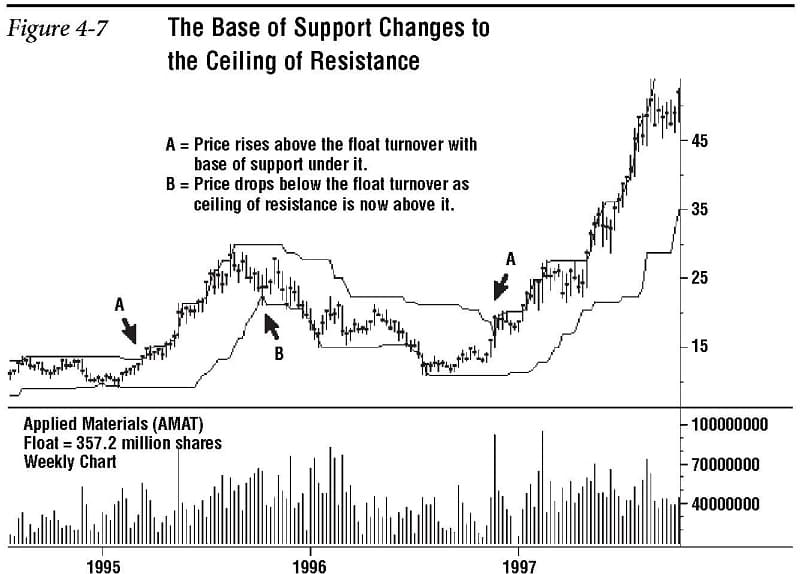
And likewise, when a stock in a long price up-trend turns around and starts heading down, its float turnover will change from a base of support to a ceiling of resistance. Applied Materials (AMAT) shows this well, as does Semtech Corp. (SMTC) (see figures 4-7 and 4-8).
Unique Points of Support and Resistance in Up-Trends and Down-Trends
Price Reversals at the 50% Support Point —Support down under and Overhead Supply
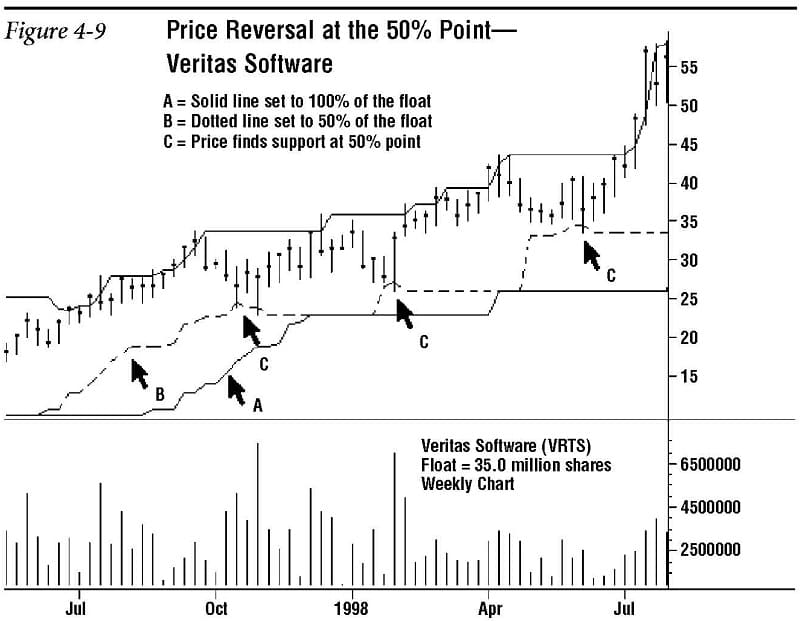
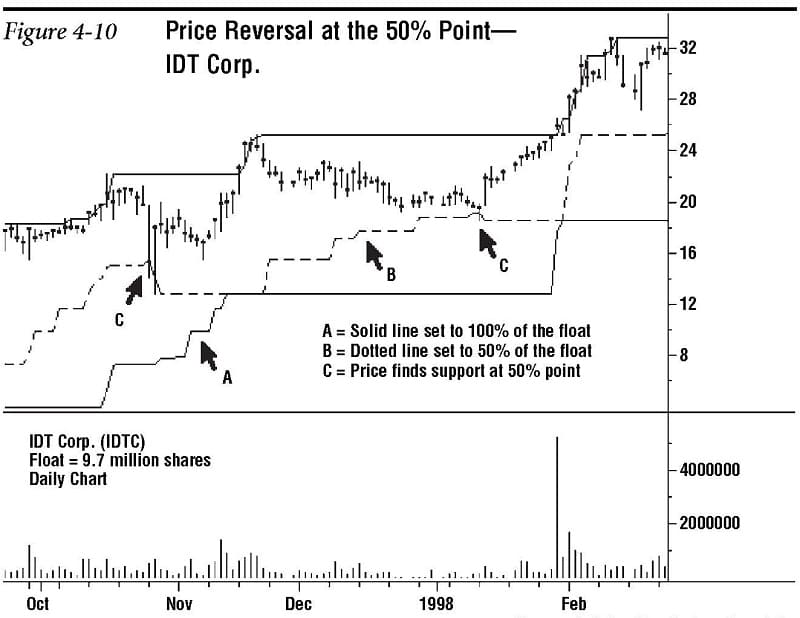
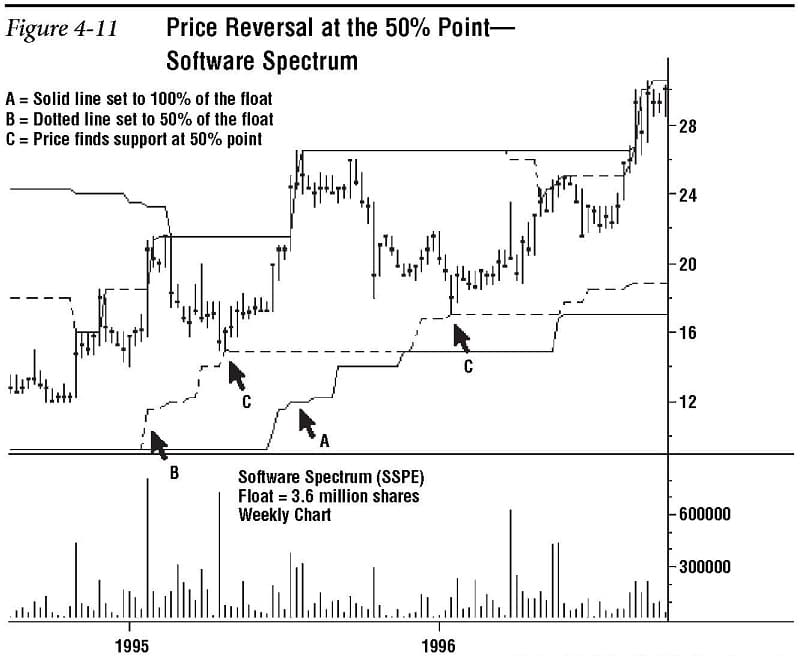
There is a strong tendency for stock prices to find support or resistance halfway through the float turnover price range. This midway point in the float turnover is an area of great power. During long upward or downward moves, a stock’s price will inevitably go against this long-term direction for short periods of time. Stocks going up have short downward price corrections, and stocks going down have short upward price retracements. A natural point of price reversal in this activity is the 50% level of the float turnover price range.
One way to see this is by plotting the historical channel indicator twice. One indicator is set at the actual float number, and the second is set to half this first number. When we do this, we find an amazing number of stocks correcting and retracing to this midway point in the float turnover. This midway point acts like a fulcrum for the forces of supply and demand. Good examples include Veritas Software (VRTS), IDT Corp. (IDTC), and Software Spectrum (SSPE) (see figures 4-9, 4-10, and 4-11).
Stocks that are making long down-ward price slides also have price reversals right at this mid-float point. Short rallies stall here as they run into overhead supply. In addition, stocks that have topped and are heading lower often go through brief rallies to the upside that continue to the halfway point in the float turnover’s price range and then resume their downward fall. Good examples of this include Applied Materials (AMAT), Inso Corp. (INSO), and Health Management Systems (HMSY) (see figures 4-12, 4-13, and 4-14).
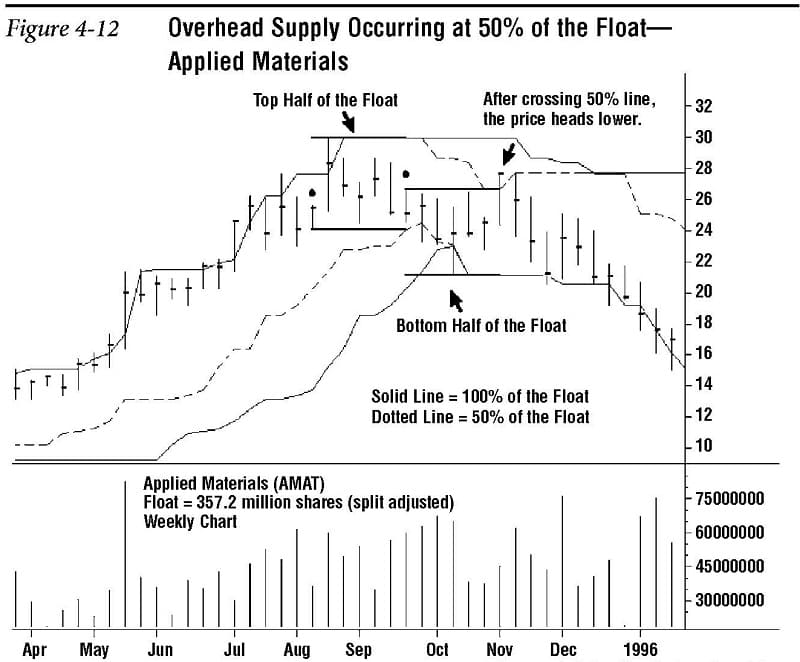
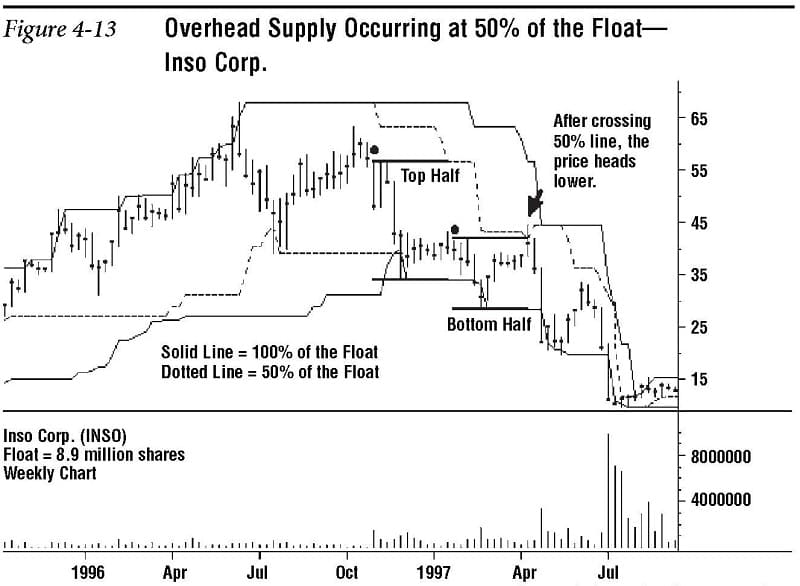
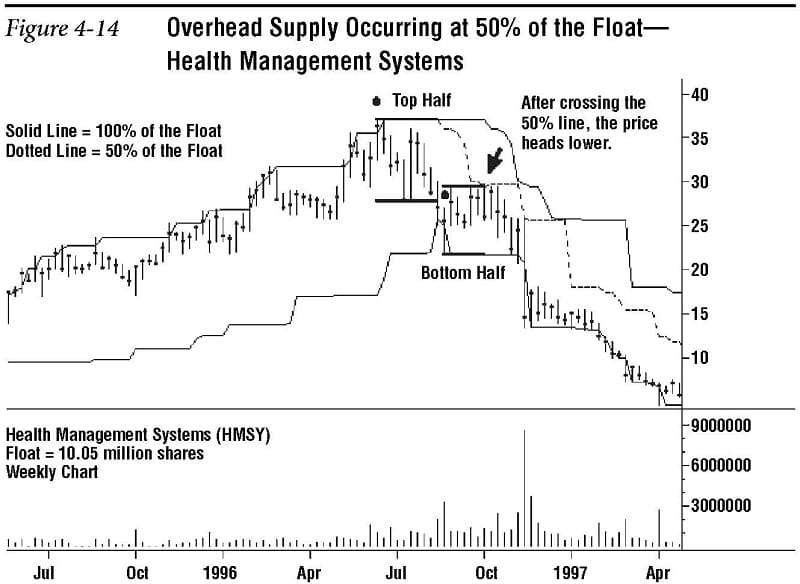
Thus, stocks in up-trends often correct downward, finding support at 50% of the float turnover, and stocks in down-trends often swing upward only to find resistance at this same 50% point. Support and resistance at the 50% level of the float turnover is one of the most potentially profitable phenomena in float analysis. Stock prices turning at these points are so common as to be seen on just about any stock you care to study.