Trading Articles
Gann Time, Price and Pattern Analysis in Market Timing
Gann was a wholistic trader. Just as a wholistic doctor considers all aspects of his patient’s health mind, body and spirit. Gann considered all aspects or dimensions of the market in his analysis and trading. The three dimensions of the market are time, price and pattern. Trading activity is not likely to be successful unless the position of the market relative to each dimension is considered at all times. Any trading plan that is to be consistently successful must consider all three dimensions of the market before a trade is initiated.
Factors
Time Factor: Gann considered time to be the most important factor in the marketplace. If we are able to time our trades properly, we will take all the profit that is available from market activity. Market timing is the least understood and often not considered in a traders plan.
Price Factor: Price analysis is usually the easiest dimension of market activity to prepare for. Once a trader understands proportion and ratio of price activity, it is not difficult to determine well in advance the price levels that have the highest probability of reversal. However, price should only be considered relative to the time and pattern factors. The weakness of most trading systems is that they only consider price in their analysis. The result is almost a guarantee of a losing trading plan if price is the only consideration in making trading decisions. This is why virtually all trading systems and trading plans based on price alone are a sure road to failure in the business of speculation.
Pattern Factor: The trader must be familiar with past price pattern activity relative to any market he wishes to trade. All markets undergo repetitive price patterns over time. A study of past price pattern activity will reveal those price patterns that repeat over time and indicate the most probable subsequent price activity to anticipate when they are recognized.
Only when the trader recognizes that each dimension of market activity must be considered in a trading plan is success ensured. Gann recognized the importance of considering all aspects of the market at all times when he stated, “Use all the rules, all the time.” There is no one rule or dimension of the market that will determine a trading plan and a cause for taking action. The importance of each factor is only relative to the position of the market relative to the other factors.
Let’s see how we would integrate each factor into a trading strategy that would indicate when to position ourselves in low risk and low capital exposure trades. Let’s take a look at the time, price and pattern position of the gold market going into September. We are going to examine how we would view the position of the gold market relative to all three dimensions of the market prior to an important change in trend. If any trading methodology or trading technique is valid, it must be able to indicate at any time in any market what decision is to be made. I will describe some the time, price and pattern factors that were evident at this point in time.
Time
There are three important time factor methods Gann described. I have described these in past articles in this magazine. 1) Time Cycle Ratios -every time cycle is related to a past and future time cycle in an important proportion found throughout all natural activity. 2) Time Counts – there are particular counts of time from prior important highs and lows that project when change is likely. 3) Price Square Time – the value of important price highs, lows and ranges relates to future time cycles. This relationship of price to time is a unique concept of Gann. (Please see Table 1).
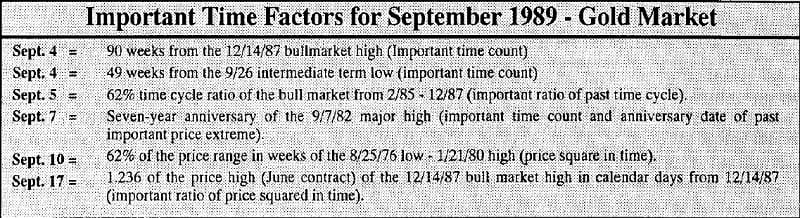
These are all important time factors relative to major price cycles and extremes that indicated an important change in trend was probable in September 1989. There were many other intermediate and shorter term time factors that coincided with these dates. Time factors alone do not indicate whether a change in trend is likely to be a high or low or how important that change might be if it should unfold. That is why the time factor must be considered relative to the price and pattern factors (please refer to table 1).
Price
Price should always be viewed from all perspectives, not from just a single contract month’s prices or the spot prices. Let’s look at the price relationships of the gold market from the December 1987 high from two perspectives, the December and June contract month prices and the spot or nearest futures prices. Across the top are the dates of important intermediate term swing highs and lows beginning with the bull market high of December 14, 1987. They are labeled with wave counts for reference. The numbers in parenthesis are the price swing from the prior high or low (please refer to table 2).
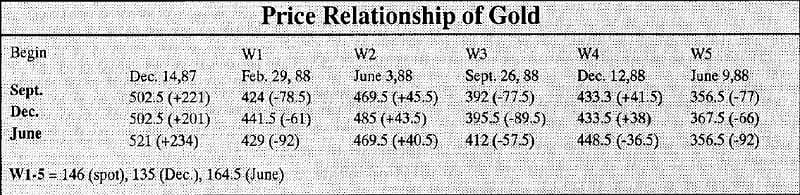
The initial decline into the February 1988, low was a $92 swing, just $3.00 beyond a Fibonacci 1989, verses the June contract prices. Prices of many markets often make short, intermediate and long term highs and lows at the termination of price swings at or very near numbers in the Fibonacci series. The initial major advance from the February 24, 1985 bear market low was a price swing of $92 low verses the June contract made a bottom at a 39.3 percent retracement of the February 1985 – December 1987 advance, just less that $3.00 from a 38.2 percent retracement.
The W3 range was 89.5 verses the December contract. W3 verses the spot contract was $77.50, just one dollar short of the W1 swing verses spot. As you can see, if a trader or investor were only to view the price activity of a single month’s contract prices, this important and typical relationship of W1 and W3 would not have been evident. Verses all three price perspectives, W4 and W2 were closely related. This is another typical relationship of corrections to a trend.
W5 was 92 verses the June contract prices, exactly equal to W1. W5 was $77 verses the spot prices, within $1.50 of W1 and W3. W5 bottomed at a $146 range from the December 14, 1987 high verses spot prices. One of the most important Fibonacci numbers is 144. The W5 low was made at a 67 percent retracement of the February 1985 -December 1987 advance verses the spot and December prices. It is critical to view the markets from several price perspectives to get an accurate picture of the price position of the market. Many so called Gann trading and analysis experts ignore spot prices. Gann did not, and neither should you. As you can see, the spot price relationships were critical in understanding the price activity from an intermediate and long term perspective. The various price factors indicated that the $355-$360 price level would have a high probability of resulting in significant support. There were many other price factors relative to prior shorter term price cycles that also indicated support at this price zone.
Advanced Books and Courses on W.D. Gann Methods


Pattern
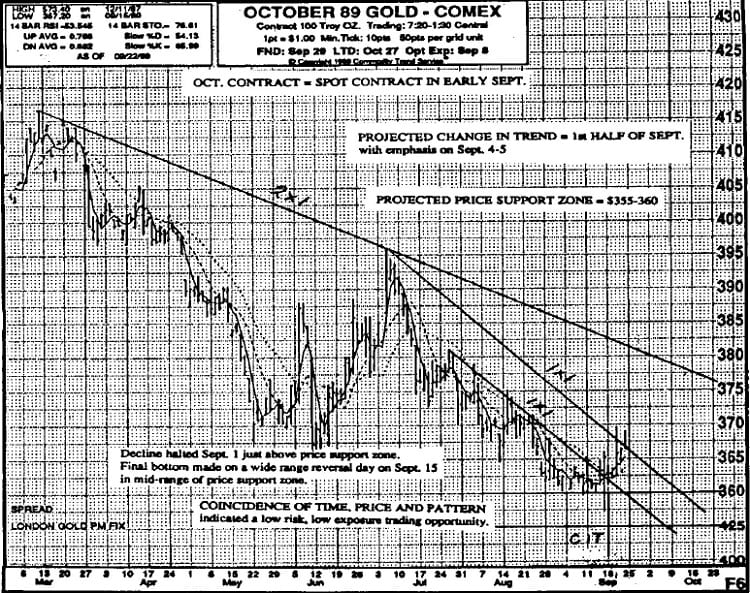
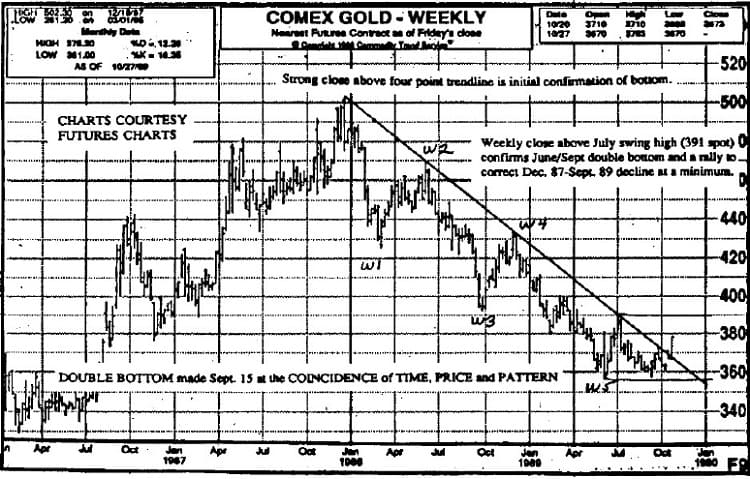
The weekly spot chart for gold is illustrated on the following page. From an Elliott Wave perspective, gold may have made a textbook five wave pattern into the June 1989 low. The wave/price relationships certainly exhibit the symmetry typical of such a pattern. Gann described this typical price pattern long before Elliott’s work. Gann described it by stating that, “Most trends terminate after three sections in the direction of the main trend.” If the June/September double bottom verses spot prices is to result in an important low from where a rally will ensue that will at least correct the entire decline from the December 1987 high and will be greater than any other rally since the December 1987 top, the June/September double bottom must not be exceeded verses the spot prices.
The intermediate term time, price and pattern factors had all indicated in advance that an important low was likely to form in the first half of September near the $355-$360 price zone. It must be emphasized that all this information relative to each dimension of the market was available in advance of a change of trend. When time, price and pattern coincide to indicate a high probability of a change in trend, we are able to enter a position in the market with low risk and low capital exposure. Let’s look at a trading strategy that would take advantage of our time, price and pattern analysis.
Trading Strategy
Assumptions: 1) Time Factor – the cluster of longer term time factors indicates that the first half of Septermber is likely to result in an important change in trend. The most important time period is likely to be September 4-5. 2) Price Factor – the price zone of $355-$360 is likely to result in significant support. 3) Pattern Factor -price pattern activity indicated the completion of a longer term price pattern in the $355-$360 price zone. If price were to reach the important price support zone in the time period indicated, a low risk opportunity to enter a position would be presented.
Gann stated throughout his work to only enter a position on, “indications of change in trend. In other words, go with the flow of the market activity. No matter what the market analysis indicates, have the patience to wait for the market’s activity itself to indicate change before taking action.
Price made a low June 9 at 356.5 verses the spot contract right in the important support price zone. The price and pattern factors indicated an important low was probable. However, the time factor was not yet evident. On September 4, price tested that low verses spot prices. The time factor now indicated an important longer term low was likely at this price and time. The market was now making a double bottom at an important price support zone, completing pattern that typically results in an important change in trend at a time period that indicated change was likely. A trade should only be entered when the market activity itself suggests a reversal in trend.
My strategy was to enter a long position on any day beginning September 5 (September 4 was a holiday) that price made a reversal day. In other words, a day when a new intraday low is made with a close above the prior day’s close. Each day a new close only order is entered if a new intraday low is made. Reversal days do not unfold at every top and bottom, But when they do at the coincidence of time, price and pattern indications of change, it is a sure sign of at least a minor change in trend.
On September 15 price makes a new low and closes above the close and high of the prior day on a wide range reversal day. A long position is entered at the close at $369. Stop is at $362.50 or one dollar below the prior low of September. Normally I would place the stop one dollar below the low of the reversal day. In this case the reversal day was such a dramatic, wide range day that it was not necessary to place the stop that far away from the close of the reversal day. If price was to continue to advance, it should not exceed the nearby minor support prior to the reversal day low. Three days later, price makes another wide range advance and exceeds the reversal day high and close. The low of September 15 is confirmed for at least a minor advancing swing. Once an initial swing high is made and exceeded, confirming the continuation of the advancing trend, the stop will be advanced.
We can never know how far or how long a trend may continue. The objective is to enter a position at the coincidence of time, price and pattern in order to position ourselves for an extended trend swing. If the reversal and subsequent swing results in a minor move, I have at least reaped a small profit that keeps me in the game for the next opportunity to position for an extended swing. At this point in time (October 30), the price activity has not confirmed the September 15 low as a longer term low. With the stop advanced with the rally above the initial swing high of September 27, at least a modest profit of $1000 per contract is ensured. Only a weekly close above the July high (390 spot) will indicate the continuation of the advancing trend. There are no certainties in the market place. The best a trader can do is to develop a trading plan that takes advantage of the time, price and pattern factors and trading strategies. ‘Trading success is ensured to the trader who follows proven trading techniques and strategies and exercises the discipline to only enter trades when all dimensions of the market indicate reversal of trend or trend continuation.
I appreciate that you mentioned how price analysis is usually the easiest part of market activity to prepare for since it only needs the trader to understand the proportion and ratio of price activity to determine the price levels with the highest probability of reversal. I imagine if you’re interested in the trading market, it would be best to also review Gann trading methods. I’ll be sure to keep this in mind if I ever need trading in the future.