Trading Articles
Gann Angles and Squares Explained: Dave Green’s Approach to Time and Price
W. D. Gann traded for over 50 years and reportedly made $50,000,000.00 trading from the early 1900’s through the early 1950’s. In his Trading Course published in the early 1950’s, he said Geometric Angles were “the basis to his forecasting method”. Gann used many diverse complex and exotic techniques but angles and squaring seem to have been his primary methods. Therefore, this article concentrates mostly on the angles and squaring methods.
Most important & reliable concepts involving angles. ..Markets will usually go up or down, on average, at a percentage inclination or declination paralleling one of the geometric angles. Second most significant area, is the market will frequently and support or meet resistance when the price hits an angle going in the opposite direction. General concepts and observations. ..A market that is declining will frequently receive support and possibly rally as descending price hits an angle drawn up from an important swing low due to the angle squaring and gravitational fulfillment taking place. If in fact, it is a bull market, the price will likely ascend to the next steepest angle above the advancing support angle as a result of gravitational attraction.
In a bear market, the price may only receive minor support from the below up sloping bull angle and not rally to the next greatest steeper bullish angle, instead it is more likely, due to gravitational attractions, to move to the least steep declining angle drawn down from a prior important swing high or crash through the underlying bull angle support without a rally taking place. A market that is advancing will frequently receive resistance and possibly decline as advancing price hits an angle drawn down from an important swing high due to the angle squaring and gravitational fulfillment taking place. If in fact, it is a bear market, the price will likely descend to the next steepest angle below the declining support angle as a result of gravitational attraction.
In a bull market, the price may only receive minor resistance from the down sloping bear angle and not decline to the next greatest steeper bear angle, instead it is more likely, due to gravitational attractions, to move to the least steep advancing angle drawn up from a prior important low or smash through underlying bear angle without a decline occurring. Points to originate the angles from.. .Gann talks at length about “swing highs and swing lows” and he refers to the geometric angles as “moving trend lines”. That is exactly what they are. The angles are the only way possible to draw a valid trend line with only one reference point (swing high/low) available or in use.
Correctly drawn angles on a square chart and drawn from important swing highs/lows will frequently be a strong area of support or resistance when the price intercepts angles. A swing high can be defined as a high or high point with lower highs in front and behind the high point. Conversely, a swing low is a low or low point with higher lows in front of or behind the low point. One way to tell if angle support/resistance failed is price closing at 2% to 3% (of the current price) above or below an angle for two or more consecutive days, indicates a strong possibility that the current angle gravitational attraction is weak compared to price momentum and the next nearest angles gravity attraction. This is a warning of a price direction reversal.
Advanced Books and Courses on W.D. Gann Methods


Angles drawn from different points.. .Quite often, when angles radiating from separate swing high or lows meet, that marks a market turning point or change of trend. Sometimes, if not the exact day, within a few days of the crossing point. Also, price gets drawn to cross points, and angle crossing points sometimes will mark cycle high/low. We will now analyze 3 charts. We will look at the charts like we were actually analyzing the markets from a realtime perspective for hands-on learning. It is important that you properly align the dates on the bottom of each chart to identify the day or time periods involved. The charts are courtesy of Omega Research.
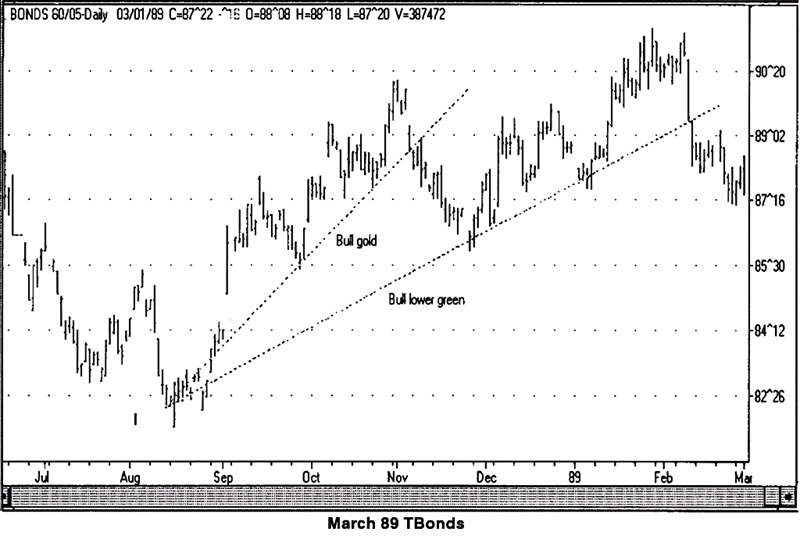
March Tbonds chart.. .The TBond chart displays both a bull 45 degree angle and a bull lower angle, both coming up from the major low in August. Note how the market received strong support, and then moved up, after touching the 45 Angle in September and again in October. Note how the market received strong support, and then moved up, after touching the other angles in November, December and January.
Another valuable tool is the observation that once the market hits a support angle for the third or fourth time (4th time in particular), it will frequently penetrate the support angle and transform from a bull market to a bear market or vice versa. The sudden angle penetration that just occurred in February was the fourth attempt to penetrate the angle and indicates the start of a bear market.
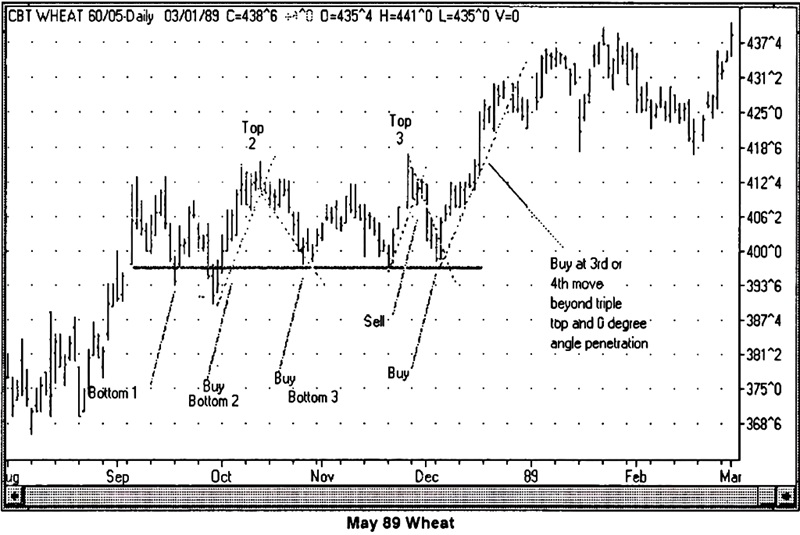
Also, the 45 angIe was hit 3 times prior to the significant November decline. May Wheat chart This Wheat chart shows the Gann concept of buying and selling against both double and triple tops, expecting resistance at the double/triple top Zero Degree or near zero angle, and expecting support at the double/triple bottom Zero Degree or near zero angle.
The chart also reflects a longer term buy signal once a fourth attempt at the triple top is penetrated. Remember, at the third or fourth attempt to penetrate horizontal resistance, a penetration and strong continuation move, after the penetration, is a fairly common occurrence. Also, the chart uses short term angle penetrations to confirm move of the miscellaneous buy/sell signals. Reason for picking this particular at looking chart was that it shows these techniques can also work in a sideways market or congested time period. Large moves or good trends are not mandatory to work with these techniques.
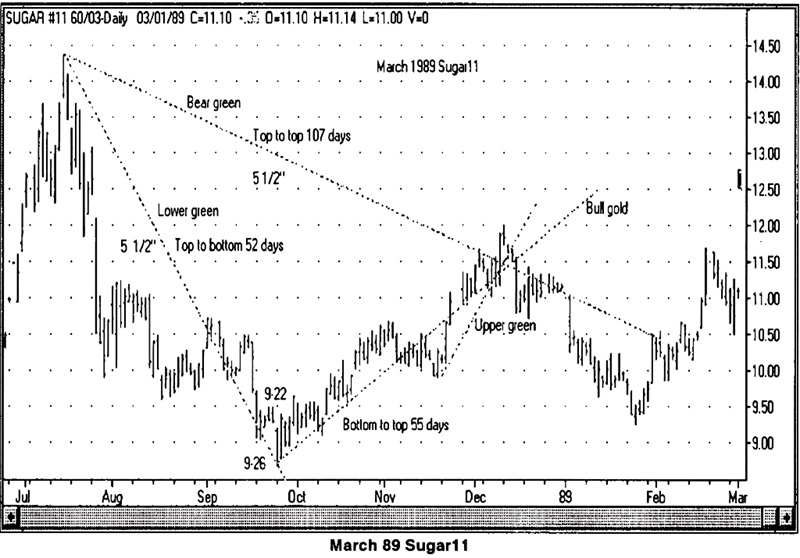
March sugar chart.. ..The Sugar chart presents some interesting but complex and sophisticated little known aspects to the angles, plus a never before revealed surprise technique involving measurements of the angle lengths. From the major high of 1439 recorded on July 14th the market moved down to its major low at 869 on September 26th. As you may recall, since Sugar moves in 1 point increments, the square of 1 is important. Since the chart has a grid value of 5 we will multiply the squares by a factor of 5.
The multi-even square of 1 is 10, square of 10 is 100, and 5 times the chart grid value equals 500. Thus we can look for time running out about 500 points below the major high. As previously outlined, since the July high was a volatile period, we draw the bear angle from mid-point of the range, radiating from near the 14 cent level. That is also a preferred price to draw from, as it is a whole even number. We observe that the reverse square of 500 is 50. Therefore, 50 days from the high is a possible turning point, especially true due to the price itself being close to a 500 point drop from its high. (1439 – 500 = 939).
September 22 high was 948 and 931 low. Median price for this 50th day was in fact 939!
This day exactly squared out the range from the high based on the multitudes and derivatives of the square of 1 combined with the graph scaling! As a further conrmation of a trend change prediction we can look at the bear angle. On September 26, the price squared out but the price completed a 2 day pattern High Low Close (denition, as previously outlined) and closed weak near its low.
That indicated the bear angle was still strong enough to influence the price down in spite of time running out. Also, the price should square again by hitting the angle after time was squared. These items indicated the market could still move a little lower. On the day of the major low the price closed down and right at the bear angle. That confirmed a squaring of the angle taking place after the time ran out. Now that the angle had again been squared we can look for buy indications. Finally, in early October the price moved sideways to up, sufficiently far from the bear angle, to conrm a break away.
That is especially noticeable if viewed by a perpendicular measurement from the angle slope. We can draw a new bull 45 Angle from the September low and note the market followed the general trend of the 45 Angle up from September to December. On December 12th we should start looking for a top because of a new subject you are now going to learn about, which is Bull and Bear Angles crossing from different directions.
The bear upper angle from the July high crosses over the bull angle on the exact day of the highest closing price. Also, the next day, December 12th, the price itself ran out of time and closed weak after completing both a high-low-close pattern and a reversal down day during this 2 day cross-over period. Also, the short term bull upper angle drawn up from the minor swing low of November also crosses over both major angles on the same date.
Lastly, I would like to tell you about a unique and unusual technique I have developed for measuring the angles to predict trend changes. As far as I can tell Gann or others were not or are not familiar with this technique, so it is unique! Measure the Sugar bear lower angle from the July high day mid-point angle starting point, to the September low. Then measure the bear upper angle from the same high and project the same distance to the angle. Where the measurement intersects the bull 45 angle from the major low marks the turning point! The exact turning point as far as time is concerned and fairly close to the actual price turning point! I have also observed this technique to work when applied to certain angles in miscellaneous markets.
Thus we have many different confirmations that a change of trend is imminent. In fact, we have so many powerful indications of a change of trend occurring about December 12th, that going short here would be about as close to a guaranteed successful trade as is possible! Finally, on December 15th a breakaway day occurred involving a significant percent drop under the bull 45 angle and now confirming the market was following the bear upper Green angle from July high. That indicates the end of the bull move and start of a new bear move.