Trading Articles
Four Trading Principles Learned Over Three Decades in the Markets
If you had the opportunity, why not learn a thing or two from those who have already figured out what works and what doesn’t? Here’s a chance to soak up some wisdoms as one trader shares lessons he learned as he traveled along his 30-year trading journey. when I first started out, I taught myself fundamental analysis and then added technical analysis, so that today I use a comfortable blend of approaches. My trading activities allowed me to retire at the age of 36. That was over 20 years ago. Let me share four trading lessons I learned along the way.
1. Hold longer. Earn more
In 2005, I read an article about an accounting firm that handled the tax returns for over a thousand traders. Of them, 36% were profitable in 2004. In addition, just 4% of them made over $50,000 trading. In 2004, the S&P 500 index closed the year 9% above where it ended the prior year. The NASDAQ Composite gained 8.6%. I made 19.2%.
Why were the majority of traders unprofitable in a year that saw the indexes move higher? I remember thinking about my returns and found that the more I traded, the less profit per trade I made. I pulled up my trades from the early years and drooled over the results. On my first trade, which was in Essex Chemical in 1983, made 88%. I bought it again in 1984 and pulled in 123%. I pocketed 195% in Carter Wallace, also purchased in 1983. Why couldn’t I make the same kind of money now?
Answer: I didn’t make those gains in one year. The hold time was about 2.5 years for each. Further data digging revealed that my highest returns came from holding between three and four years. Could the real secret to making money in the stock market be to hold longer? I returned to my spreadsheet and found that my median hold time was 93 days (not counting daytrades). Trades lasting longer than that made five times more money (on a percentage basis) than did those with shorter hold times. Five times more. Wow.
As conditions warrant, I adjust my trading style, from buy & hold to position trading to swing trading (I no longer daytrade). For example, after the 2007–2009 bear market ended, I analyzed the markets and found that I had a window of about two years when the market would explode (be wildly bullish). I bought a number of stocks and held on for big gains. Now, the market is struggling with setting a new direction, so I am swing and position trading.
If you are having difficulty making money in the markets, switch to a longer hold time. You don’t have to abandon day or swing trading. Just add a different trading style. For example, if you are a struggling daytrader, add some swing trades (where you buy at the swing low and sell at the swing high, or the reverse, holding from weeks to months). If you are a swing trader, try adding position trades (where you exit before the primary trend changes, holding from months to years). In other words, diversify your trading style and hold longer. You may find yourself making more money.
2. Diversify
The 2007–2009 bear market hurt. Wounds from the bear taught me to diversify. I computerized my position-sizing algorithm, but here’s the gist of it: I let the index bounce around up to 20% below its peak before I reduce the amount of money allocated to a position. For every 10% drop in the index beyond that, I cut the amount allocated to each trade in half.
For example, if I allocate $20,000 per trade, and the S&P is off less than 20% from its high, I do nothing. At 20% down, I cut the size to $10,000. When it hits 30% off the peak, I cut the size to $5,000 and so on. I can still trade, but do so with smaller and smaller amounts. I then shrink the position size for market and stock volatility. When the bear market ended, I started buying again and found that with smaller position sizes, I could own more stocks in more industries. In essence, I became a fund manager controlling a portfolio of about 30 stocks with every two or three stocks sharing the same industry. Yes, you get 85% diversification from owning eight stocks (see the Vakkur article), but I wanted a smaller percent of my cash in each, just in case I timed the bullish turn wrong.
How did I do? In 2008, I lost 14.5% compared to the S&P’s drop of 38.5% and the NASDAQ’s 41.5%.
3. Overconfidence kills
The chart in Figure 1 shows a swing trade I completed just a few days ago. In early 2015, utility stocks were beaten down for reasons I have yet to discover. I thought they would bounce back and looked at an exchange-traded fund (XLU) to make a swing trade. At point C, the tall white candle suggested the fund had bounced off support (B). I show the support/resistance area between the two red lines.
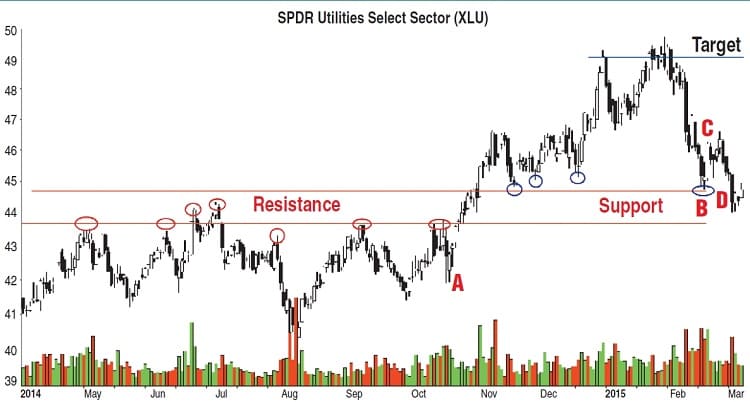
The fund bumped up against a ceiling of overhead resistance in 2014 several times (red circles). Once it punctured that ceiling, it rested on underlying support (blue circles). I felt the fund had turned up and was now going to soar to the target (blue line).
What if the trade went bad? In my experience, I found that stocks that make a straight-line run (such as the move up from A to November) can return to just above the launch price. The launch price is where the stock breaks through a congestion area and begins its straight-line run. For this fund, the run began at A. Not all stocks will behave this way, and it is important to remember that when the stock tumbles, it will stop its return just above the launch price (not at it). If the trade failed, I expected the fund to drop to 42 and change before finding support.
Advanced Books and Courses on Trading Psychology and Discipline

With a target price and potential loss in mind, I bought the fund at the open the day after C and received a fill at 46.10. After placing the trade, I felt confident, too confident, that the stock would swing up to 49. Uh-oh, I thought because previous trades had taught me to be alert to such overconfidence. In the past, whenever I thought trading was too easy, I lost money—often a lot of money. As a swing trade, I don’t give the security much leeway. If the trade goes against me, I cut my losses quickly. For this trade, I set a mental stop to sell if the fund closed below the low of candle B. That happened at D. I placed a sell order to execute at the next day’s open and received a fill of 44.33, for a loss of 3.9%.
The lesson from this trade (as I learned long ago) is to be especially careful when you feel confident a trade will work. This often happens after a series of successful trades. It is as if everything you trade turns into a winner. This may lead you to thinking that this is an easy game, or that you can’t lose, or that this is like shooting fish in a barrel. That overconfidence leads to disaster when the trade goes against you. You know the trade will win so you give it more time to behave as you expect. The loss grows and soon, you have lost so much money that the brokerage firm cannot afford to close your account. (That’s a joke).
4. Leverage Kills
Another trade killer is the use of leverage. When I wrote my book Swing And Day Trading, I included a chapter on horror stories. Traders shared their stories, and half of them included the use of leverage. When they lost money, they lost big. Here is an another example of an actual trade from a man I’ll call Dave. He began his trading career in 1990 by buying stocks recommended to him by trading journals and friends. He used a buy & hold approach in the booming Indian stock market, but made money on only 40% of this trades. Some of his holdings went bankrupt. He started to do his own research and his results improved, but not remarkably so. In 1992, more of his cherished IPO allotments went bankrupt when the Sensex dropped 56% in just over a year. He says he never thought of selling.
In 1993, he turned to technical analysis, changed jobs, and lost Internet access. He found a neighborhood broker and used him to place trades. Another disaster occurred when he bought a stock and the next day, the government announced a duty hike on the raw material the company used. The stock dropped and he lost a lot of money. He stopped trading for nine years.
In the summer of 2004, he read an interview with trader Dan Zanger and switched to trading using chart patterns. His win record climbed from 40% to 84%. In 50 trades, he had eight failures, giving him an average gain of 60%. In 2005, he started looking at trading currencies in the spot market. In a competition at the brokerage firm he used, his currency trades placed him in the top five and then he hit number one. He made 2.3 times his money in just five weeks.
Flush with success, he bought 13 contracts in GBP/USD (British pound/US dollar) worth $1.3 million. When I heard that, my jaw dropped. Until that trade, the largest amount he had ever spent on a trade was $5,250. Suddenly he was trading $1,300,000, courtesy of leverage.
At the end of the first day, he had an unrealized gain of $6,600. The next day, the currency eased lower. He checked his work, felt the drop was a normal Fibonacci retracement, and became convinced that the currency would recover. His world ended two days later when the currency hit his stop. It took him out for a $28,600 loss. Before this trade, his largest loss was just $2,700. Not only did the trade damage his self-esteem, it almost wiped out his account.
Be especially careful when you feel confident that a trade will work. This often happens after a series of successful trades.
The Moral of The Story is…
There is an old joke that says, “In the stock market, if you want to make a small fortune, start with a big one.” For Dave and for others, if you want to wipe out your account, use leverage.
- Thomas Bulkowski is a private investor and trader with more than 30 years of market experience and considered by some to be a leading expert on chart patterns. He is the author of several books including Getting Started In Chart Patterns , and The Evolution Of A Trader trilogy. His website and blog, www.thepatternsite.com, have more than 600 articles of free information dedicated to price pattern research.