Articles
An Introduction to the Methods of W.D Gann By By Bryce T. Gilmore
William Delbert Gann (or as he preferred W.D. Gann) was a pioneer in the area of time and price analysis of market activity. Born in Lufkin Texas in 1878, Gann’s basic premise was the future is just a repetition of the past and that time governed all market movements. Gann traded with and taught time and price analysis methods that could predict market highs and lows. Gann reputedly had the knowledge to forecast the price and time of the yearly high and low for commodities and stocks.
W.D. Gann, both a keen trader and a workaholic, published many books the titles were:
- The Truth of the Stock Tape
- How to Make Profits from Puts and Calls
- Tunnel through the Air
- Magic Word
- How to Make Profits in Commodities
- 45 Years In Wall Street and New Stock Trend Detector As well he produced many
- instructional courses on trading later compiled by Billy Jones into 2 trading courses;
The W.D. Gann Commodity Course and the W.D. Gann Stock Market Course.
Gann was a prolific researcher throughout his lifetime with interests in numerology, weather forecasting and astrology. A very religious man and a 33rd degree mason, Gann claimed he learnt about forecasting price movements from the Bible. His knowledge of mathematical and astrological relationships was very advanced. He used this knowledge to formulate trading and technical analysis techniques which students could follow to identify support and resistance levels for most free trading markets.
Gann and the creator of Elliott Wave theory – R.N. Elliott – shared some similar beliefs about market activity. Gann believed that Bull or Bear campaigns took 3 or 4 sections to complete the move. Elliott believed that there were 3 impulse waves in a Bull or Bear trend, with the possibility of an extended 5th Wave to give Gann’s 4th section. Gann believed that markets most commonly retraced 1/2 (50%), 5/8s (62.5%) or 3/8s (37.5%) of the previous range. Elliott believed that markets most commonly retraced 61.8%, 50 % or 38.2% of the previous range.
Gann had an arsenal of price tools he taught students and it was reputed he charged $5000 for a weekend course in the early 1950’s, before his death in 1955. This article will cover many of Gann’s important time and price tools. Other tools such as The Square of Nine, Square of 144, Square of 90, Hexagon Chart and Gann’s various Master Calculators will be covered in future articles Gann’s books are required reading for any trader or analyst who wishes to understand the basic ways to view any market. The knowledge outlined in his works can easily be overlooked due to the abundance of information he presented. Just the same the pattern of information remains identical throughout all of his published work. Gann always said “History Repeats” and repetition was his way for students to get the message.
Gann’s work included Money Management Rules and Trading Psychology concepts expounded by many of today’s top traders. He believed that you did not have to be in the market all the time to make money. Here are some quotes from W.D. Gann taken from his last book, How to Make Profits in Commodities. Page 11.
“TIME TO STAY OUT OF THE MARKET: This is something important for everyone to know. You cannot make money by trading in the market every day or by getting in and out every day. There comes a time when you should stay out, WATCH and WAIT until you determine a DEFINITE CHANGE IN TREND. Long periods of rest and relaxation protect your health and help your judgment which will result in profits later.”
Suggested Books and Courses About Gann Techniques
W. D. Gann Master Commodities Trading Course
Original price was: $25.00.$12.50Current price is: $12.50.
Gann’s Scientific Methods Unveiled (Volume 1 and 2)
Original price was: $19.49.$9.75Current price is: $9.75.
“THE BEST WAY TO TRADE: The most money is made by swing trading, or in the long pull trades, that is following a definite trend as long as the market trend is up or down, you must learn by rules to wait until the market gets out of a rut or a trading range. Wait for a definite indication that it is going higher or lower, before you take a position for a long pull trade. Always figure that YOU CAN BE WRONG and that the market could reverse. Therefore, follow your profits up with a STOP LOSS ORDER, or get out when you get a definite indication that the market has reached a turning point and that the trend is changing.”
As a picture is worth a thousand words we will now look at some charts. Please examine each chart closely as there are some important points on them.
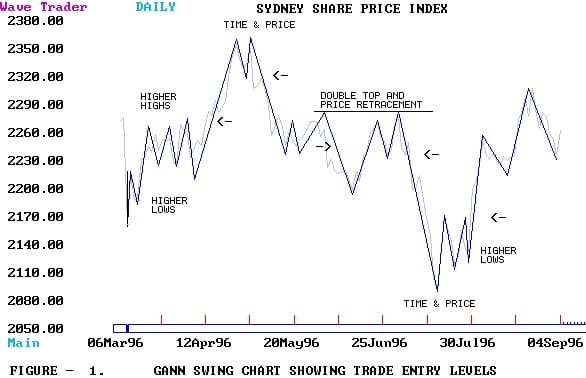
Gann’s main trading philosophy was to trade with a close stop loss and select the most opportune trades in the direction of the main trend. To confirm a trend was in progress, he would look for lower highs and higher lows to form after a major reversal in trend. The method he used to monitor trends and filter out any random market noise was the Swing Chart. Figure 1 shows an example of a Swing chart. After July 30 1996 Gann would have said the trend in the SPI was up as it was making higher lows and higher highs. Gann would be a buyer of the SPI from 2170.
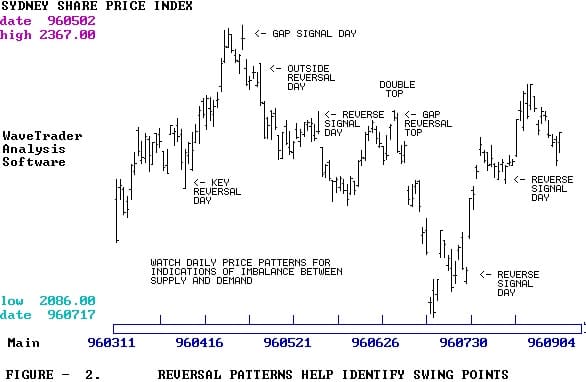
Gann placed a lot of importance on the daily price patterns. He talked at length on the different types of reversal patterns you can use to identify an imbalance between supply and demand. Figure – 2 shows some of the bar chart patterns Gann looked for to confirm turning points or to get him out of trades quickly with minimal loss.
Gann taught students to face the facts and eliminate hope and fear. For instance, if a trader receives a margin call, he should close the position immediately, for the chances are he is wrong. He also taught that a successful trader studies human nature and does the opposite of what the general public does. Most traders lose money because they are too greedy, they over trade, they expect abnormal profits in normal markets.
Gann’s analysis techniques for predicting major market tops and bottoms were based on cycles. Gann believed that the future was only a repetition of the past. Gann maintained that as each new generation exerted its influence on the markets similar bull and bear markets would unfold. Gann’s 20 year cycle relies on the fact that human nature never changes. Therefore as each new generation came to power they would behave similarly. Their inexperience in speculation would cause markets to rise and fall to prices unwarranted by supply and demand. The result is that when the BOOM is over, the young generation suffer severe losses, get some valuable experience and are not eager to try it again. To predict a top or bottom for the year Gann would look at the market activity in the years back 10, 20, 30, 40, 50, 60 and 100 years for similar conditions.
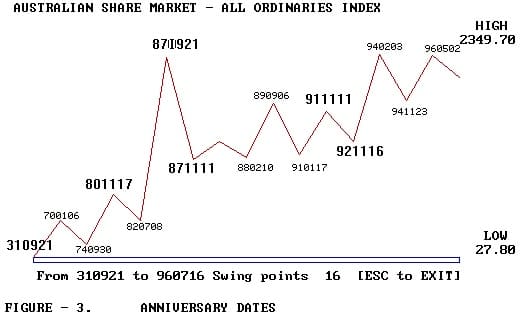
The first basic technique Gann taught students was to watch anniversary dates with past market tops and bottoms for a change in trend. When it came to shorter term analysis of time, Gann devised a system of counting off time in solar degrees of a year from past market tops and bottoms. He counted divisions of the year in eighths and thirds. When clusters of time counts from past tops and bottoms highlighted a future date, that date was significant for a reversal of trend.
Figure -3 shows the major anniversaries in the All Ordinaries
The cycle of one year has 365 days. The circle of one year has 360 degrees. The Earth revolves around the Sun in an elliptical path moving closer to and away from the Sun during its orbit. This is the reason the days and degrees relationships speed up and slow down. To explain, there are 4 cardinal points in the circle, 90, 180, 270 and 360 degrees. As the Earth moves around the Sun the daylight hours progressively get longer and shorter every six months. The shortest day of the year in the Southern hemisphere is June 21, (in the Northern hemisphere it’s the longest day), the shortest day is known as the Winter Solstice (this is 270o). The longest day of the year is December 22, 90o, the summer solstice.
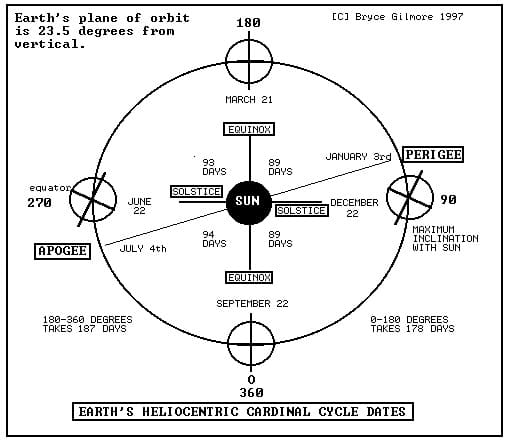
September 21 (360o) and March 21 (180o) are the days when daylight and darkness are equal, these are the Equinoxes.
The four seasons of the year evolve around these 4 points. Some people may recognise these cardinal points at angles 180 degrees opposed to this explanation. Refer to Figure – 4 and note that the 2310 high in late August 96 came on 1.75 (1 and 3/4 years) x 360o or 630o solar degrees from the November 23 1994 Low at 1793.
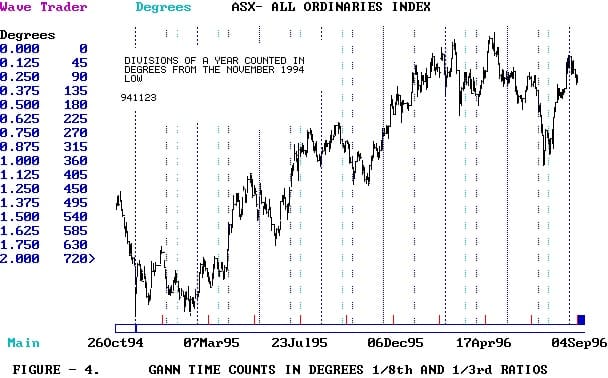
It is important to realize that the Earth takes 179 days to move from 0o to 180o around the Sun. Yet, it takes 186 days to move from 180o to 360o around the Sun. The two points in the circle, of one year, where the relationships between days and degrees begin speeding up and slowing down are the perigee and the apogee. The perigee (distance to the Sun is closest) occurs about January 3 each year, the apogee (distance to the Sun is furthermost) occurs July 4 each year.
Suggested Books and Courses About Chart Patterns
Wyckoff Analytics: Setting Price Targets Using Wyckoff Point and Figure Projections
Original price was: $299.00.$33.45Current price is: $33.45.
Support & Resistance Simplified
Original price was: $15.81.$7.91Current price is: $7.91.
Naked Trading Techniques By Walter Peters
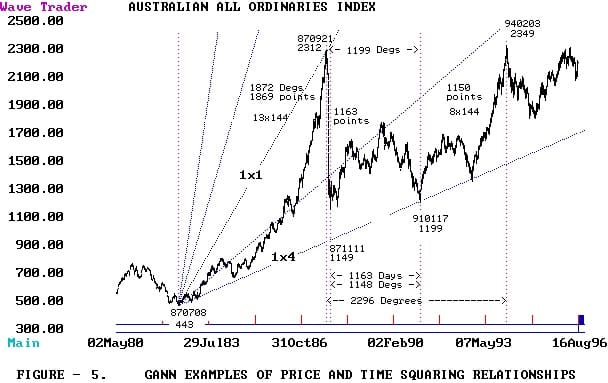
Original price was: $154.00.$24.01Current price is: $24.01.When comparing cycles it is preferable to work in degrees for greater accuracy, for this you need to use an ephemeris or a computer program, such as CycleTrader, capable of calculating degrees precisely. Gann developed a unique method of squaring price to time and time to price. He taught that every stock or commodity maintained a vibration where there was a relationship between 1 degree of price to 1 degree of time. The difficulty with many stocks and commodities is in finding what value represents 1 degree of price. For the purposes of this demonstration I have used the All Ordinaries Index and used 1 unit of price to 1 unit of time. A market can square price to time in several different ways.
- 1. Price units in a trend equal time units in a trend.
- 2. Base price equals time units to a new change in trend.
- 3. Prior price range equals times units to a new change in trend.
- 4. Prior time units equals next price range to a new change in trend.
- 5. Current price equals time units from a prior change in trend. (zero angle).
To keep a track of the position of his price to time he would draw GANN ANGLES up from lows and down from highs. He also used 4 to 1, 2 to 1, 1 to 2 and 1 to 4 angles. 1-4 means 1 unit of time to 1/4 unit of price. If you study Figure 5 carefully you will see an example of each of the methods Gann used to determine when a change in trend could eventuate.
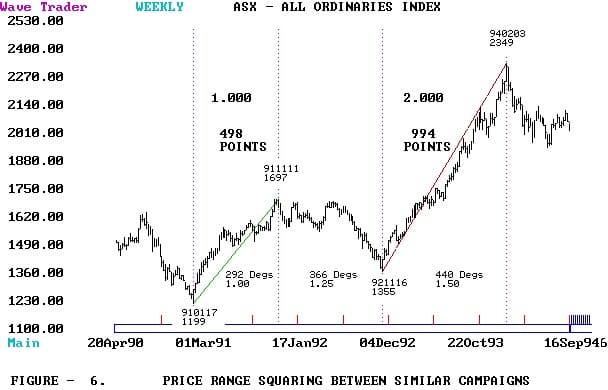
Gann placed extreme importance on squaring between price ranges, these could be retracement levels or alternating campaigns. The All Ordinaries Index between 1991 and 1994 is a perfect example of squaring between price ranges. See Figure – 6. Range 2 is 2 times range 1.
The example in Figure – 7 epitomizes everything about Gann’s knowledge of order within the market. The time by degrees in each alternate trend “squared” between extreme tops and bottoms. This example should get any trader’s or analyst’s attention.
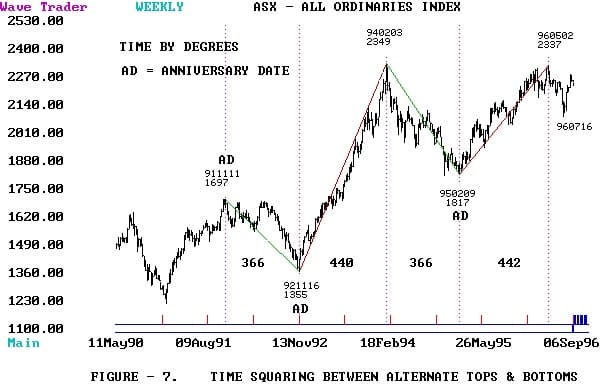
When I first read Gann’s words, “Time is the most important indicator. When time is up the market must change trend.” I crossed the threshold of market knowledge, inspired to learn more. Ever since, I have been rewarded with a knowledge allowing me the patience to wait for the major setups to trade. The principals illustrated here will work with all degree of market trends, anything from 7 days to 5 years.
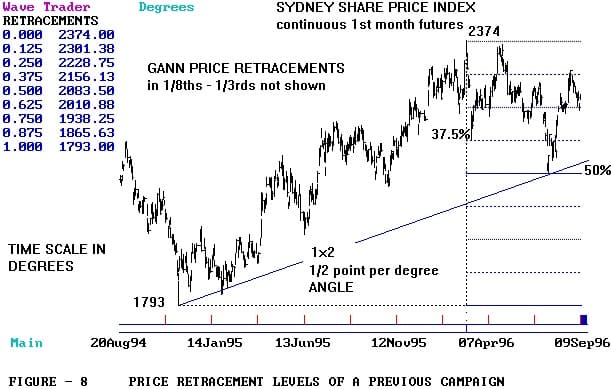
Most analysts should be familiar with price retracement levels acting as support or resistance between trends of similar degree. Gann taught his students to measure prior price ranges and divide them into 1/8ths and 1/3rds, these levels can act as support in a downtrend or resistance in an uptrend. When a market reaches these levels and reverses, all the trader has to do to verify a trend change is to look for a clustering of time cycles on that day. Gann angles also determine time & price intersections. Figure – 8 shows the recent 2086 low in the SPI on July 17 achieving an exact 50% retracement and the March 11 post election panic low at 2158 was on a 37.5% retracement.
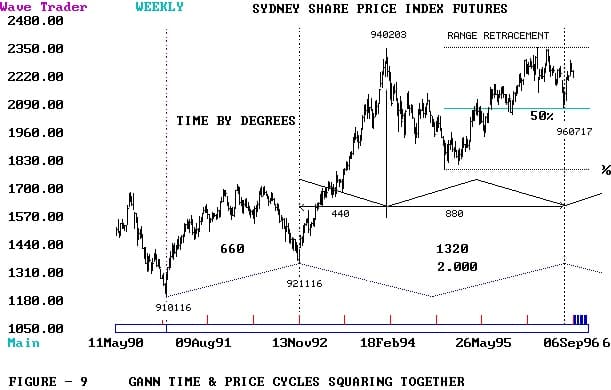
The day of 17th July 1996 when the SPI reversed trend on the 50% retracement of all the gains made between 1994 and 1996 there were several important time cycles peaking. I have shown 2, the time between the major lows in 1991 and 1992 was cycling 2.00 times and the time between the 1992 low and the 1994 high was cycling 2.00. It is quite amazing how the market continues to vibrate between highs and lows in a pure geometric form.
Most people do not realize how easy it is to identify time cycles in advance. The charts in this article were prepared using my personal WAVETRADER / CYCLETRADER SOFTWARE. I designed and programmed this software to give me the advantage I needed to beat the market. I have continually revised and upgraded my software over years of new experiences. Now in 1996 I feel I have finally produced a tool that gives me total control over my own trading destiny. Along the way I have made the software available to other traders, and have been amply rewarded from their input. I have found over the years there are a continuous number of new people entering the market and losing money, some depart, others regroup and try to learn methods that will make them successful traders.
The bottom line nevertheless is each trader needs tools and methodologies from which to formulate a low risk trading plan, one to follow mechanically where the trade selection process remains similar. Once the trade selection process is automated into a systematic approach, then the trader needs to have a workable money management plan to ensure success.
Gann summed it up best with a set of rules to follow, his bottom line though was, “Do not trade on guesswork or gamble on hope. Knowledge brings profits. Never trade without STOP LOSS ORDERS.” I hope these brief and limited examples of technical analysis methods illustrate what is possible, if you do a little work.