Trading Articles
Trading Stops: Initial, Hair-Trigger, and Progressive Stop Rules
Stop orders, or as everyone refers to them, stops, are the instructions given to the broker or the market or the computer to buy or sell a security depending on specific criteria. For example, “Sell my 100 shares of IBM if the market price declines to 99.” Or, “Buy 100 shares of IBM if the price rises to 101.” Stops may be used as indicated for buying and selling. Here in this discussion we are concerned only with the use of stops for protective purposes, that is, to stop a loss from running, or to protect an accumulated profit.
First, no stop system is perfect. Regardless of the way stops are calculated, and there are myriad ways, losses will occur, profits will not be efficiently seized, money will be left on the table. It is unfortunately an imperfect world. But almost any stop system is better than indecision, confusion, and doubt. John Magee developed a number of stop systems, all of them good. Their use often depends on the particular market situation and can be relatively complex (consult Technical Analysis of Stock Trends, 8th ed.), but here we cover the basics. Two situations exist in which stops should be calculated and used: entry and profit protection.
INITIAL STOP LOSS CALCULATION
When we make an initiating trade, buying or shorting a stock, we must, even before completing the transaction, compute a stop to limit the loss if the market moves against our position. Such a move is almost guaranteed to occur in trend trading. The way we deal with counter moves is to plan the trade so as to limit the loss up front. There are two ways to set the initial stop — using a money management rule or finding a technically analyzed point.
In the first case the trader would determine the percentage risk to be taken from the entry price and set the stop that distance below the entry (e.g., entry price 100; percentage risk 8%; stop price 92). Or, on the same trade the analyst might have found a support level at 95 — the bottom of a rectangle or a triangle support line — and set his stop there. Or, he might find the support level and add a fudge factor — 2% or 3% to the support level. Say, 95 plus 2 or 93. In either case the sum at risk is called (by this author) the Operational Risk. It is entirely possible that the market will take out this stop. It is also entirely possible that IBM will decline to 20, making the stop at 93 look like an act of genius.
PROTECTING AN ACCUMULATING PROFIT WITH ADVANCING STOPS
A happier situation exists when our trade has worked out well and over time has accumulated paper profits. Paper profits are real profits. They are not illusory. It is as improvident to allow paper profits to dissolve as it is to allow a loss to run for not having a stop entered. Experiences of this kind are warning signals to an investor, warning signals which may be a notice that further education is necessary, or that an investment psychiatrist should be consulted.
THE ANALYZED STOP, COMPUTED FROM THE CHART
As our stock advances it performs all the gyrations described in this book. It proceeds in a straight line up. Profit taking occurs and it falls back, perhaps as much as 50% of its run, or it drifts sideways into a rectangle, or a triangle as buyers and sellers contest the ground. It breaks out, perhaps in a gap, runs and returns to the breakout line, then battles for a few points. In short it is Every-Man’s Every-Stock. The reader of this book should have by now some idea of how to deal with these situations. He is looking for support and resistance levels, for trading and congestion zones, for trendlines and trend channels. He is learning to recognize changes of trend, signs of strength, and signs of weakness. He is also defining his personal trading style and philosophy.
Advanced Books and Courses on Risk Management and Position Sizing


Perhaps he operates on the basis of support/resistance levels, or only on trendlines. I have known successful traders who used both, or only one. Nevertheless, he finds the line significant to him, and uses it, or it plus a filter such as 2% or 3%. So when price breaks the chosen line by 2% it finds his stop and he takes the rest of the money to the bank. Naturally, he gave some of it back. If he did not give some back he is not letting his profits run until a definite change of trend is proven to have occurred. I call this the Bridge Rule, after a comment by Goren that if a declarer didn’t get set on at least 20% of his contracts he was underbidding.
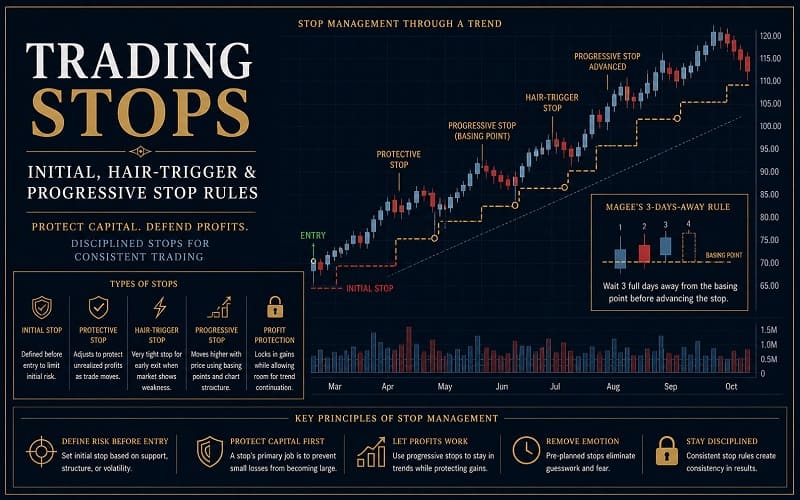
PROGRESSIVE STOPS, OR THE 3-DAYS-AWAY PROCEDURE
Another way of advancing stops is from a procedure developed by Magee called awkwardly the 3-days-away procedure, or, sometimes, the basing-points procedure.
Using this procedure the analyst determines basing points as follows:
- He observes low price points on reactions.
- He watches the market until 3 days of price activity outside the range of the low day have occurred.
- This price low is then marked as the basing point.
- The stop is then computed based on this point. The stop might be the point itself, or a close below it, or the point plus a filter which might range from 2% to 8%.
This is a summary of the process. It is actually more complex and more clever than this brief description would imply, but the procedure described here is certainly sufficient for the purposes of the general investor and considerably more sophisticated than any process used by the average unenlightened investor. Let me emphasize that this brief discussion only scratches the surface of the subject of stop setting — and it is sufficient for the general long-term investor. Chapter 8, on moving averages, discusses other methods.
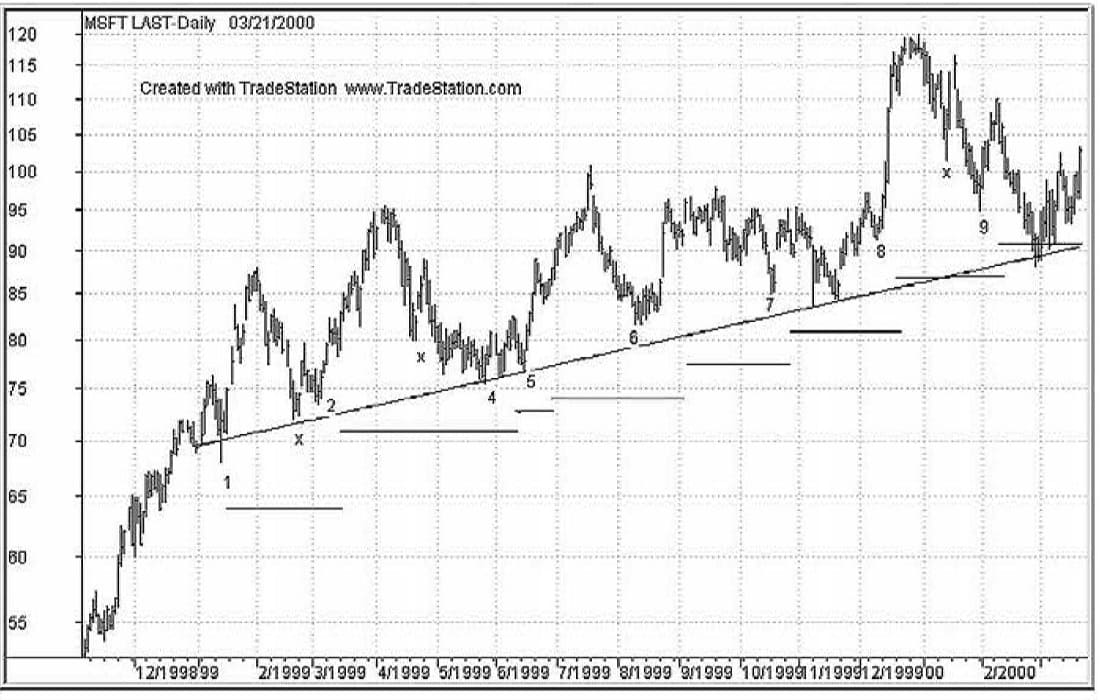
This is, perhaps, the most important chart in this book. Illustrated is a stop-setting procedure Magee called progressive stops using basing points. In using this procedure the trader finds the low of a reaction against the trend. To become a basing point the price must spend a minimum of 3 days above the range of the basing-point day. Once that has occurred the stop is set at the basing point less the filter. The filter is a percentage figure which may vary according to the volatility of the stock. As a rough rule of thumb the filter would range for most stops from 5% to 8%; 5% has been used on this chart of Microsoft. (Please note that prices are rough-cut on this chart.)
Thus, at 1 where the low is 68 the stop is set at 64.60. When the low at 2 occurs and prices move 3 days out of range above, the stop is raised to 70.12, 5% below 73.81. x now occurs between 3 and 4, appearing to be a potential basing point. However the price comes back before it has closed 3 days out of range, and higher. This makes 4 the next basing point which meets our criteria, and at 75 the stop is raised to 71.25. 5 is the next basing point at 76.625 with a stop at 72.79. No sufficient reaction occurs between 5 and 6 (generally speaking we want to see a reaction that brings price back about half way or more).
The top between 5 and 6 definitely heightens attention, looking like a spike. Following the procedure of hair-trigger or near progressive stops, some traders might set a stop ⅛ under the spike day and be taken out shortly. The longer-term trader would have found a new basing point at 6 (81.625 and 77.54). A rectangle develops with 7 as one of its points and also as a basing point (85.063 and 80.80). Between 7 and 8, price comes back as might well be expected but, because of the filter of 5%, leaves the position intact. The reaction cannot be taken as a basing point because that would cause a lowering of the stop which is against the rules. The reaction at 8, though small, offers another point, perhaps more judgmental, moving the stop to 86.87 in relation to the point at 91.438.
Between 8 and 9 the x indicates a point which does not see 3 days of action away from the price on the upside, but 9 does (94.875 and 90.13). Then in an interesting development the trade is terminated in late February by the basing point stop, and, coincidentally(?) the 14-month-long trendline is broken. Note the horizontal resistance/support line at 96 which is also penetrated at the same time. This is, of course, the top of the Microsoft bull market, and the breakout in December 1999 is of course a cruel joke — sometimes known as a bull trap.
The technical analyst has numerous tools to exercise here — the trendline, the basing points, the runaway days (which might be answered with the hair-trigger stop as discussed for the spike between 5 and 6), the round over after the runaway days and the return to the base of the runaway days (which might be taken as a throwback, but certainly not after the relative high after 9), and the failure of the support line at 96. In the markets of the millennium, these runaway days occurred many times and the result was almost always dismaying.