Trading Articles
W.D. Gann’s Master Time Factor in Market Forecasting
Time has done a great deal in adding to the legend of W.D. Gann and the trading methods that made him an alleged $50 million in profits during his career. Yet, despite his four published books and the stock and commodity courses he updated over the years, a great deal of mystery has been attached to his methods of trading. It is often asserted that Gann either did not reveal the most important of his secrets, or obscured them in his courses with very little explanation.
For vendors of trading systems and approaches, this has been used very effectively as a marketing tool in selling the “secrets” to W.D. Gann’s success. After all, the search for the “holy grail” plays on all of our emotions, and our as sense of greed. While we also have profited from the name of Gann, we believe Gann did reveal his most valuable forecasting technique, and spelled it out in clear language. Its value can only be appreciated by those willing to prove its effectiveness by looking back over hundreds of years of data in each market.
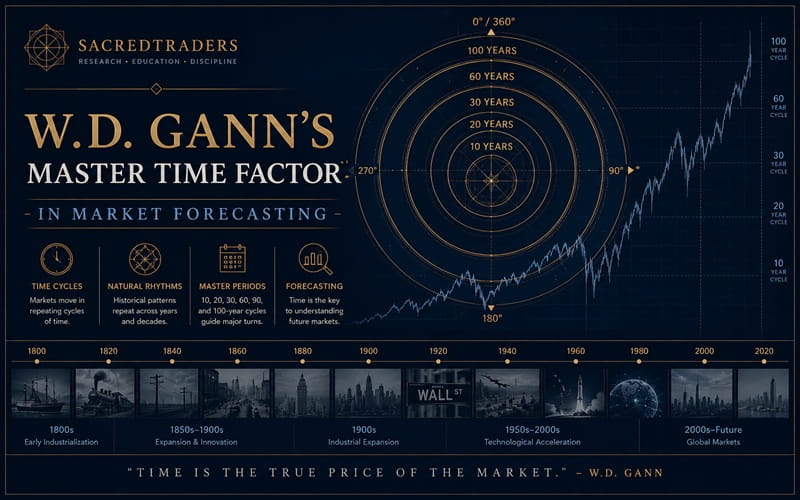
When Gann said, “I have more income than I can spend for my needs, therefore, my only object in writing this book is to give others the most valuable gift possible – KNOWLEDGE”, we believe he was sincere. Our research to date, suggests that Gann’s greatest gift was his discovery of what he referred to the Master Time Factor. In his various course he refers to the Master Time Factor alternately as Time Cycles, Major Cycles, Master Time Periods, Extreme Great Cycles and Law of Vibration. It is important that we provide a compelling argument from Gann’s own published works, of why we believe that this was his most valuable contribution.
First off, it stands to reason that he would charge the highest price for his most valuable instruction. In the 1930’s, he offered a series of three courses which he made available at $500, $1000 and $3000. Needless to say, a cost of $3000 in 1930 dollars was a very steep $20,000 in today’s dollars. The third course differed from his other courses in one major respect, it included his “secret discovery of the Master Time Factor”. This he stated clearly in the sales brochure he provided for those requesting information about his courses.
In this course, he lists the twelve things to look up before you make a trade. Heading the list at #l is, “Annual Forecast determines year of Time Cycles, whether bull or bear year and main trend of the general market up or down.” This was the Master Time Factor. It is listed as #I because it is of primary importance. It is what makes many of his other rules understandable. Reviewing some of his claims: “The law of vibration enabled me to accurately determine the exact points to which stocks and commodities should rise and fall.” “ By studying time cycles, you will learn why tops and bottoms are formed at certain times.” “In order to be accurate we must know the major cycles.” “Always consider the annual forecast and whether the big time limit has run out before judging a reverse move.”
This chastening by Gann to his students, is backed up by some of the most spectacular forecasts of highs and lows in history during Gann’s 50-year trading career. His prediction of the top for stocks in 1929 within three days, followed by a panic, is a matter of record. He accomplished this by using the Master Time Factor. In his December 4, 1946 section under time cycles I quote, “Time is the most important factor in determining market movements because the future is a repetition of the past and each market movement is working out Time in relation to some previous Time Cycles. A study of the various Time Periods and Cycles will convince you how the grain market repeats the same price levels under the same Time Periods of some previous cycle.” In the various courses Gann published between 1923 and 1954, he applies the Master Time Factor to wheat, cotton, eggs, the stock averages and U.S. Steel.
Simply stated, Gann discovered that market action repeats based on specific time cycles. The major cycles (not in the order of important) are 150, 120, 100, 90 82-84, 60, 50, 40, 30, 20,15 and 10 years. The lesser cycles are 14,13, 9, 7, 5, 3, 2, and 1 year. I quote from Gann’s $3000 course, “By studying the yearly high and low chart and going back over a long period of time, you will see the years in which bull markets culminate and the years in which bear markets begin and end. Each decade or 10-year cycle, which is 1/10 of 100 years, marks an important campaign. The digits from 1 to 9 are important. All you have to learn is to count the digits on your fingers in order to ascertain what kind of a year the market is in.”
Following these instructions, when constructing a forecast in the stock market in 1991, we look back at the years 1841, 1871, 1891, 1901, 19071909, 1931, 1941, 1951, 1961, 1971, 1971, and 1981, to establish what the overall trend was during these market cycles, and on what dates specific highs and lows were made. If there is a consensus of cycles suggesting a major topping year, and in the current market, prices are moving up into these important topping dates, we look for a top and a change in trend down.
Advanced Books and Courses on W.D. Gann Methods
Typically, the yearly time cycles will have turning points on very similar dates. Once we know whether we are due for a bull or bear year, we determine which cycle we are following most closely and treat this as the dominant cycle. In the case of the stock market, the June 5,1990 high in stocks, one day off the 100-year anniversary highs on June 4,1890 (along with 1929 the most important bull market top in history) suggests that this is the dominant cycle for us to watch. Multiple confirmation to this high was given by the major highs in September 1869, on September 5,1899, November 19,1909, November 3,1919, September 3,1929, September 13,1939 and November 28, 1980. Taken together, they added up to the major distribution top from October 10,1989 to June 5,1990.
Note that based on this 100-year stock market cycle, the major contraction did not occur until February 1893. This time window starting in January 1993 is of particular importance because it is confirmed by major tops and extreme liquidation in 1873*, 1883, 1903~, 1913, 1923, 1953 and 1973* (*emphasis added). This may set up as the greatest shorting opportunity since the 7th year panic or “death zone” as Gann called it in the years 1837,1857, 1877,1907,1937 and 1987. We believe Gann used the Master Time Factor as the most important component in determining major turning points in all the futures markets he followed. The ability to do this with a high degree of accuracy, is what made Gann a millionaire, and allowed him to make a world record more than once.
Based on Gann’s Master Time Factor, we should not be mystified by the deflation that has gripped our markets. The overall price deflation, as reflected by the CRB Index since the November 1980 all-time highs, has its sister markets in the decades of the 1870s, 1890s, 1920s and 1930s markets. The silver has been a market classic in the context of this deflation. The highs in 1980 marked the 90-year and 60-year anniversaries of the 1890 and 1920 market tops. Based on Gann’s yearly time cycles, 1992 will mark the 90-year, 60-year and lO-year anniversaries of the 1902,1932, and 1982 lows. This is an important year to watch for final lows.
During the bear markets in the years 1890,1900,1910,1930,1970 and 1980 only brief short covering rallies occurred. In each year, these rallies were completed between August and September, and were followed by the resumption of the bear moves. Using these cycles as proxies for what to expect in our current market, the August 1990 rally highs in silver offered an ideal opportunity to enter short positions. As Gann would say, you do not have to guess what the market will do, you know. Other market classics this year have been the zero year major lows in T-Bills prices (1920,1960,1970 and 1980), the zero year bull market blow-off and final top in cotton (1880, 189(), 1900, 1920, and 1980) and the zero year blow-off in crude oil (1890, 1920 and 1980). Soybeans have been the only market with mixed signals, and this probably explains the trading range we have experienced since 1989. Of particular interest to us over the next four years, is the potential for higher prices in gold. This is the one commodity that provides us with a decidedly bullish argument based on the yearly time cycles. By observing Homestake Mining (a gold stock) as a surrogate for gold when the price of the physical metal was fixed until 1971, we have constructed a very bullish long term argument for gold. Major lows in Homestake were made in 1890, 1909, }1920,1929,1950 and 1960. Add to this the abandonment of the Gold Standard in 1861 and 1971, and the likelihood exists for final bear market lows being in place. Based on these cycles, 1993 and 1994 should exhibit significant strength.
As an active researcher for twelve years in the techniques of W.D. Gann, it astounds me how few of his disciples utilize the Master Time Factor. The biggest hurdle is acquiring the historic price data necessary to make the forecasts. As Gann stated, “If I have the data, I can use algebra and geometry and tell exactly by the theory of cycles when a certain thing is going to occur again.” Once you have the data, making up a forecast is as simple as counting from one to ten. Nothing could be simpler, or more valuable.