Trading Articles
Vix And The Lemming Effect By John Zachary
Investors are prone to buy when they should sell and to sell when they should buy. How can we prevent ourselves from making these mistakes? Lemmings, small rodents best known for an instinct to charge off jagged cliffs to their deaths en masse, have immortalized the term “lemming effect.” A lemming effect signifies an event where the collective actions compel the herd to stay within the group, only to meet with tragic results in the end.
This is also an effective metaphor for the stock market, where millions of investors will follow the crowd at both ends of the extreme: up or down, bullish or bearish, with tragic results as they overplay their position. While otherwise intelligent, these people can’t seem to help themselves when the trends sputter to an end yet they continue in that direction, and then compound the problem by failing to confront the fact that their ride is over.
Where you might see tragedy for millions of investors who give in to this compulsion, there also lies the opportunity for a skilled investor to profit as well. When markets reach these points, the savvy speculator has the opportunity to ride out the uptrends with caution as the market takes share prices to overvalued heights before selling out at a windfall profit. By the same token, when share prices fall to extremely undervalued levels during a downtrend, once again, skilled investors like Warren Buffett step in to buy stocks at below wholesale prices. So if investors are prone to buy when they should sell and to sell when they should buy, how do you tell when that is likely to happen?
THE VIX
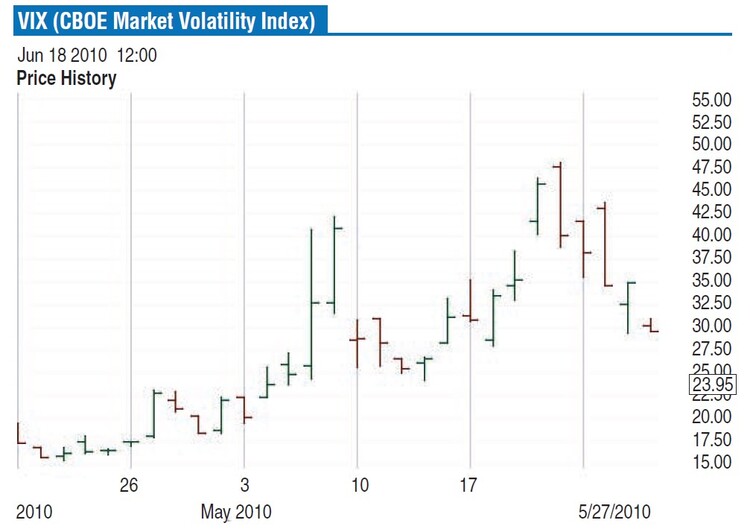
“VIX” stands for the “Chicago Board Options Exchange Volatility Index” and is a measure of the level of implied volatility of a range of options based on the Standard & Poor’s 500 (Figure 1). This indicator is known as the “investor fear barometer” because it reflects the investor’s best prediction of short-term market volatility, or risk. The VIX starts to rise during times of financial anxiety and falls as investors become complacent, which makes it the market’s best prediction of short-term market volatility.
Implied volatility is the expected volatility of the underlying asset, in this case a range of options on the S&P 500. It represents the level of price volatility implied by the option markets. If implied volatility is high, the premium on options will be high and vice versa. As a result, rising option premiums reflect the rising expectation of future volatility of the underlying stock index corresponding to higher implied volatility levels.
Suggested Books and Courses About Trading With Indicators
More important, since the premise is that crowds are often wrong, the VIX can be the best indicator to reveal at which points in the price action the market is likely to reverse itself. This approach can seem contrarian, but in fact, it is a sophisticated method for timing the market to achieve above-average returns.
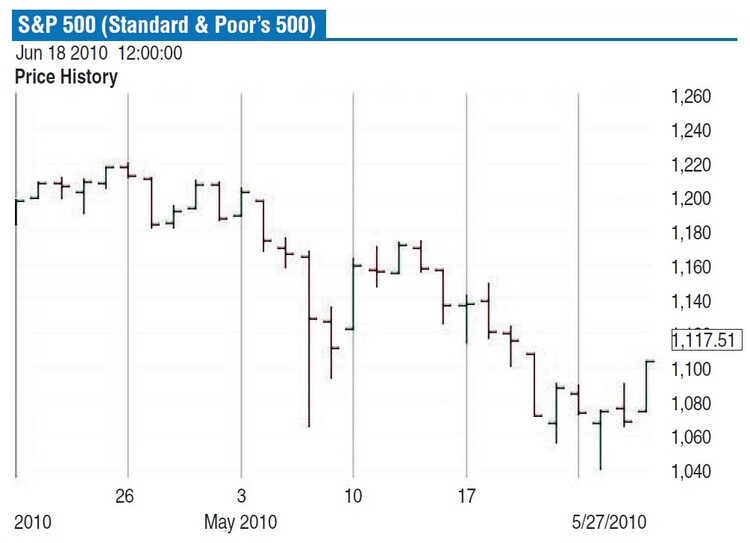
Since the VIX’s price movement moves to the inverse of the S&P 500’s price (Figure 2), you may want to watch and observe for extreme levels reached by the VIX. Since the market is dynamic, it would be a good idea to use indicators to add a visual reference of extreme levels reached and prepare for entering or exiting the market.
VISUAL REFERENCES AND MARKET TIMING
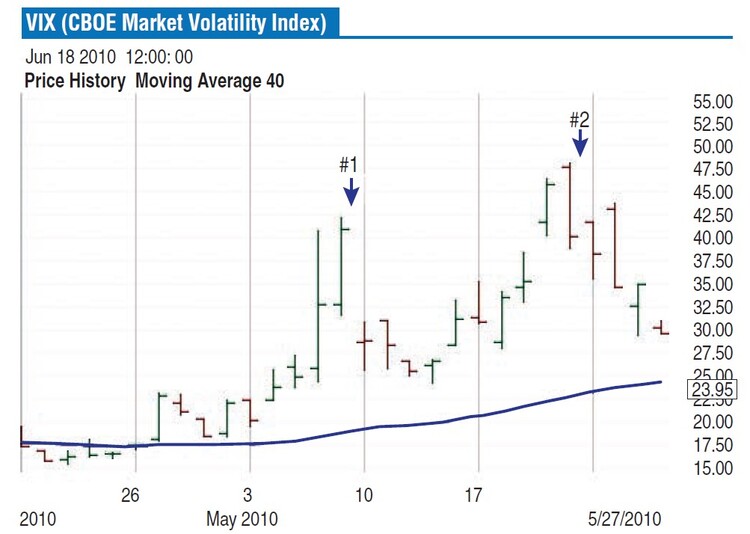
Adding a 40-day simple moving average (SMA) to the price action of the VIX on a stock chart can serve as a reference to the market’s bias. If the VIX’s 40-day SMA is trending upward and trades too far away from the SMA, then the downtrending S&P 500 is likely to experience a short-term reversal to the upside. This is confirmed when the following VIX price bar closes below the low of the price bar that set the price high. At such times, you can use this signal as a good time to buy into the market or select quality value stocks that are likely to follow the rise of the S&P after such a signal.
In Figure 3 you can observe the VIX hitting a new high as the 40-day SMA below it is trending up, indicating a very anxious market. This spike in VIX price action soon reverses off the high as it trades too far away from its SMA, revealing an extreme level where the S&P will reverse in the short term. A week later at point 2, its high is tested again as the VIX repeats the pattern while revealing another reversal point as the S&P finds price support at this level.
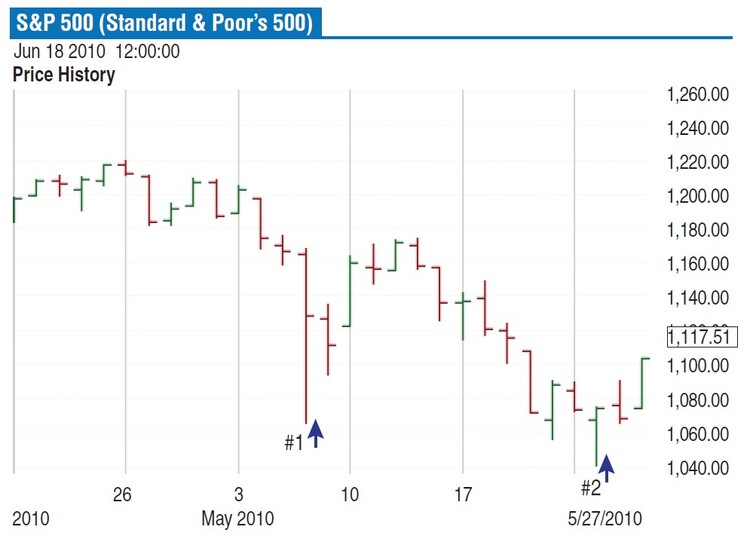
Fear guides most of the trading action on the S&P 500, which is revealed in Figure 4 in the corresponding price action of the VIX. At point 1, the S&P falls over 1,000 points on May 6, 2010, before a short-term reversal, and at point 2, as the VIX travels far away from an upward trending 40-day SMA, the S&P makes a new low, finds support, and experiences another short-term price reversal. Both reversals occur within days of the extreme VIX readings and as the S&P experiences high levels of fear at both points.
Conversely, if the 40-day SMA is trending downward with the VIX making a significant price low below the 40-day SMA, it notes the potential of exhibiting a short-term bearish reversal in the S&P. This is confirmed when the following VIX price bar closes above the high of the VIX price bar that sets the price low. At that point, it might be a good time to tighten up your stops, look at shorting the market, or get out of the market altogether.
In either case, it’s important that you understand the reason behind such an approach because buying when everyone is scared or selling when everyone else is telling you to stay vested can be tough. Having a sound approach is only half the battle, since having the ability to think for yourself and exercise the discipline to implement any trading approach is crucial when seeking above-average returns.
INDEPENDENT THINKING AND DISCIPLINE
In any form of investing, the moment of truth comes right before you pull the trigger by entering or exiting any position. It can be excruciating at times when the rules for your system or method signal a trade, but you have to understand why you have a system or method to trade in the first place. The thinking and analysis have been achieved during the method’s development and you must have faith in your ability to implement the trades.
That faith is drawn from your self-discipline and dictates your trading approach while always maintaining a sound plan of risk control. If you don’t have the discipline to carry out your trading approach, it is like being the world’s greatest surgeon who is scared of blood: you are ineffective and doomed to failure.
Adding the VIX to your tools helps you time the stock market. Independent thinking while using the discipline to act accordingly will not only help you make money using the VIX but, more important, keep you from making tragic mistakes like so many aspiring investors and traders do when the market is trading at extremes.
John Zachary has been trading and writing about the markets for the last 25 years, specializing in high-growth stocks and short-term option trading.