Trading Articles
Using Noise By Ron Black
Price can do one of three things: Move in the direction of the swing, not move, or reverse swing direction. When the price is not moving, we have noise. Here’s how you can use that noise to help decide when to enter and exit trades. In my Last article, I discussed the Clear method, a way to determine the direction of shortterm price swings. The method identifies the direction of the current price swing and the precise day the swing direction changes. It requires no calculation and has no delay. It is applicable to all stocks, commodities, and indexes in any time frame.
We saw how, unlike most technical indicators, the Clear method does not use the open or the close for its analysis. Instead, it uses the range of the daily price bar as the measure of price uncertainty. I looked at how price bars are simplified distributions. Since prices are distributed, we consider the price to be different only if the two distributions (price bars) do not overlap; the bars must be “clear” of one another.
MOVEMENT OF THE PRICE BAR
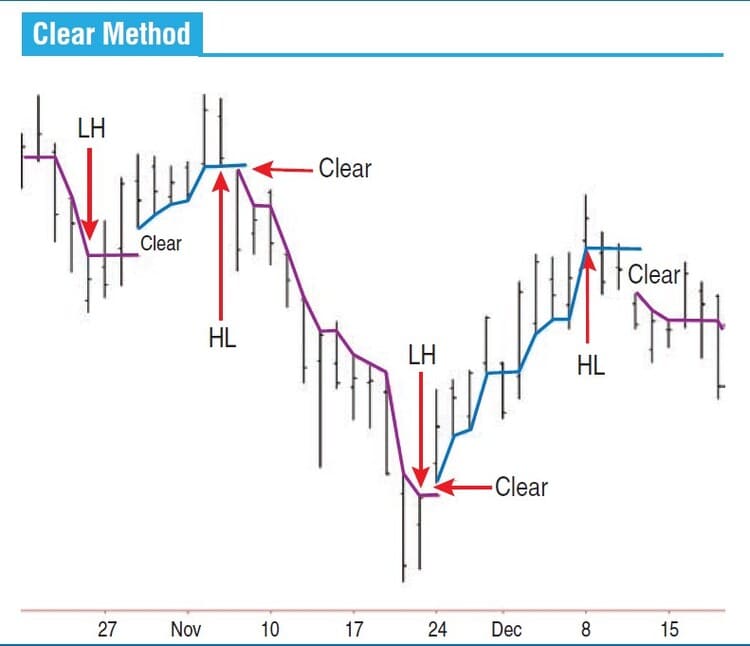
Figure 1 shows the Clear method in action, showing the up swings, down swings, and the “clears” that define the changes in direction. In this article, I will look at how the method defines the only three things price can do: move in the direction of the swing, not move, and reverse swing direction. When the price is not moving, there is noise. I will take a brief look at the noise percentage as a measure of continuous directionality. Finally, I will look at a way you can use noise to decide when to enter and exit trades.
Each day, market participants buy and sell at different prices because no one knows (or can know) the exact value of a given stock or commodity. There are various interpretations of value, so buy/sell transactions occur at various prices during the day. These transactions cause the range of the daily price bar. As statistician W. Edwards Deming noted, there is no absolute measure of anything. And, of course, that includes stock and commodity prices. Prices are wiggly and inexact, and the range of the price bar shows just how wiggly prices are on any given day.
Visualize the length of the price bar as measuring the width of a river. Each day the river meanders a bit, veering left or right. Its direction may move only slightly in relation to the previous day. Sometimes the river goes through a narrow stretch, and the price bar is shorter. Sometimes the river is wider and the price bar is longer.
However, we are interested in the whole river and where it is going. Following the closing price is like following a canoeist paddling down the river. She may ride from bank to bank or stop at a rock in the middle. We are not curious about her meandering route because we already know she is going to be on the river somewhere. We want to identify where the whole river is going. Therefore, our primary interest is the movement of the whole price bar.
DIRECTIONALITY AND NOISE
During an up swing in price, each bar can reveal one of three things: the price has moved up, the price has not moved, or the price has moved down. We can see an example of this in Figure 2. During an up swing, we watch the bar lows. We know the price is rising if the lows continue to rise. During this up swing, the first six green bars show continuously rising prices.
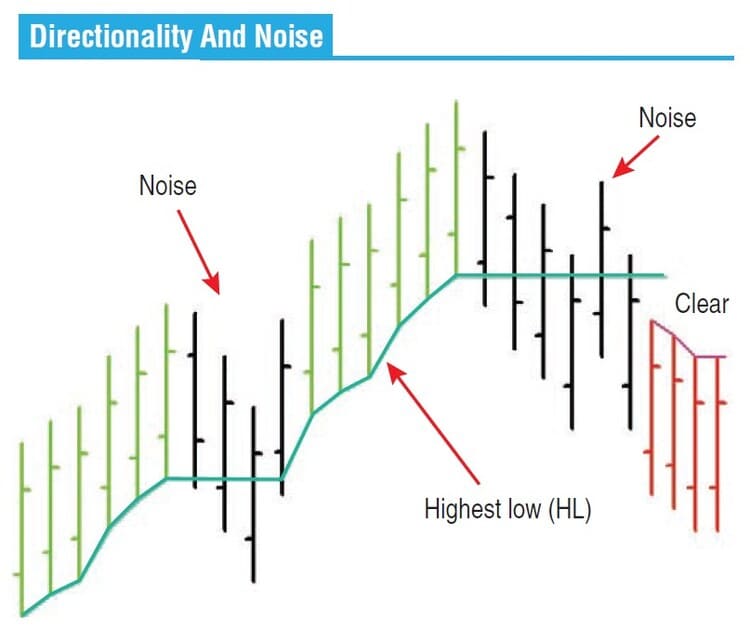
When the lows rise, the highest low (HL) rises with them. The next four bars are noise. Take the first black bar, for example. The price is not moving up because the bar’s low did not move higher. The bar is not clear, so the swing direction has not changed. The bar’s high is above (or equal to) the HL and the bar’s low is below the HL. The bar is straddling the HL. The upward price swing is hesitating but not changing. We have no new directional information. This is noise.
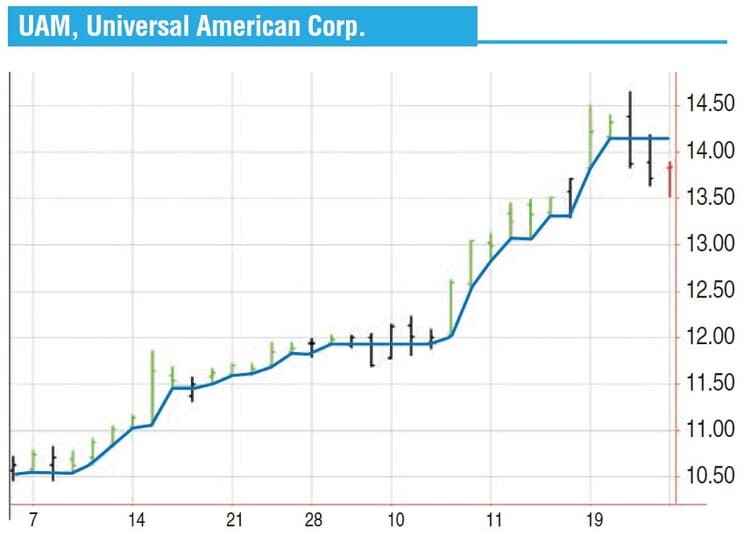
After the four noise bars, the up swing resumes for six more (green) bars as the bar lows begin to rise again. Then, we have six noise bars that are straddling the HL. The fourth bar from the end of the dataset (the first red bar) clears below the HL, and a new down swing begins. A real-life example can be seen in Figure 3, which shows Universal American Corp. (UAM) from December 14, 2009, through January 25, 2010. In this chart, we can see an up swing (green) that is occasionally interrupted by noise bars (black). In the week of January 19, 2010, there are two noise bars that precede the change to a down swing (red) on the last bar of the chart.
Similarly, during a down swing, each price bar can reveal one of three things: the price has moved down, the price has not moved, or the price has begun to move up. We can see an example in Figure 4. During a down swing, we watch the bar highs. If the bar high moves down, the price is moving down in the direction of the swing. The first six bars of this down swing show the price continuously moving down. As the highs fall, the lowest high (LH) falls with them.
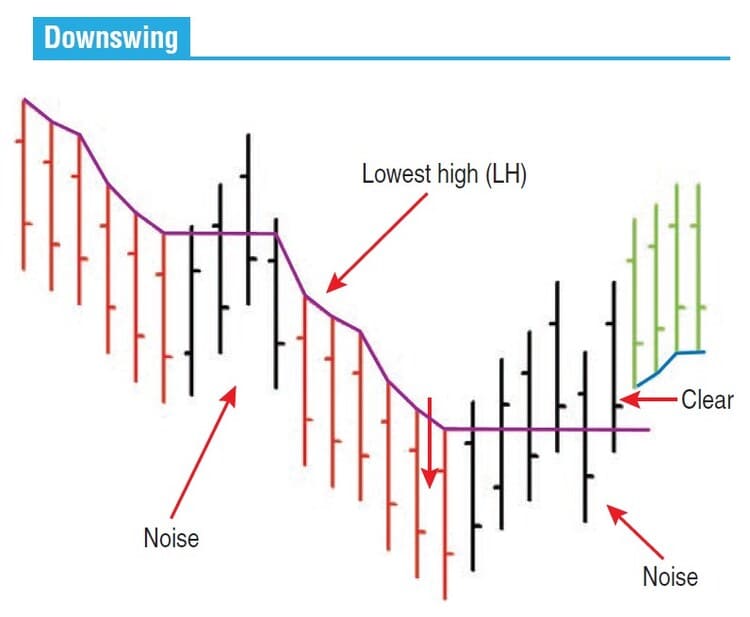
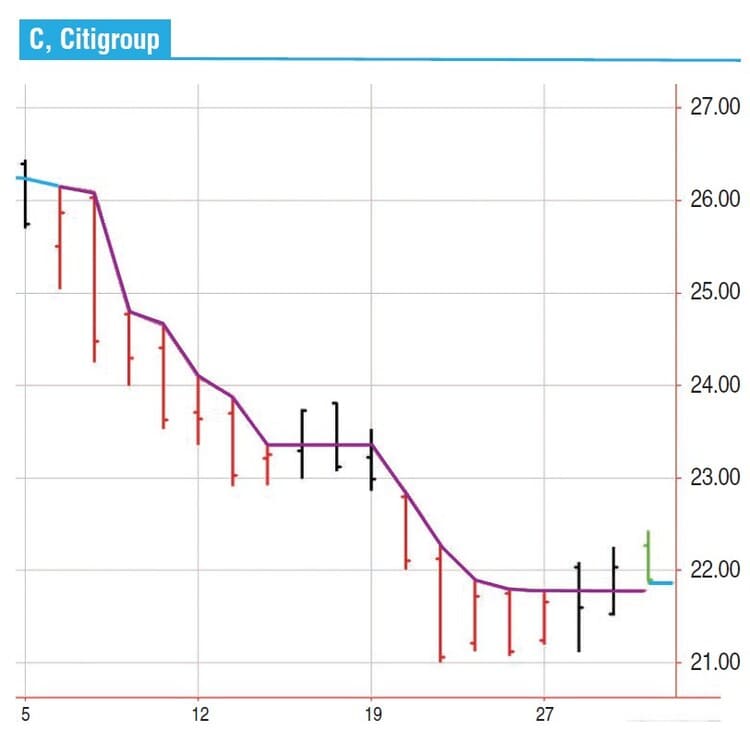
Then we have four noise bars. They are straddling the LH because their highs are above the LH and their lows are below (or equal to) the LH. After the first four noise bars, the down swing resumes as the highs continue to fall. The down swing is interrupted by six noise bars, where the price remains unchanged. Finally, on the fourth bar from the end of the dataset, the first green bar clears above the LH and a new up swing begins. A real-life example of a down swing with noise can be seen in Figure 5, a chart of Citigroup Inc. (C), from May 5 to May 30, 2008. Noise bars are always followed by one of two things: a continuation of the swing, or a reversal of the swing. Changes in swing direction are almost always preceded by noise bars, but noise bars do not always predict changes in swing direction.
Some people explain noise bars by saying the market is “hesitant,” “exhausted,” “indecisive,” or (one of my favorites) “unable to gain traction.” Beware of these anthropomorphic descriptions. The market is not a human being. The market is never indecisive nor exhausted (although individual traders may be). Saying the market is exhausted is like going to the beach and saying there are no big waves today because the ocean is exhausted. Stock and commodity prices move due to changes in the company, its fundamentals, and in the economic environment — there is no indecision. If today’s price bar is a noise bar, it simply means that conditions today are pretty much the same as they were yesterday.
PERCENTAGE OF NOISE
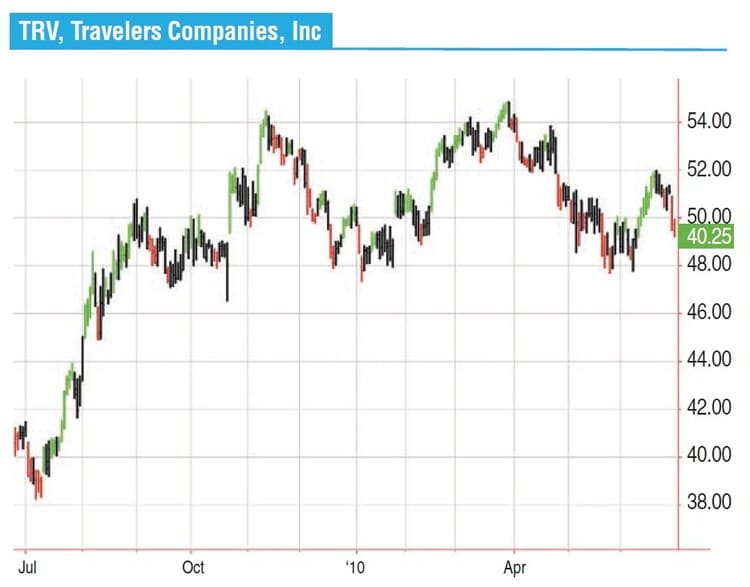
The Clear method reveals that much of price action is noise. Two examples of actual price patterns showing the up swings, down swings, and noise are shown in Figures 6 and 7. Figure 6 shows The Travelers Cos. (TRV) for the year ended June 30, 2010. During that year, 53% of the price bars are noise (black bars). TRV has swings that are slow and hesitant, leading to many noise bars.
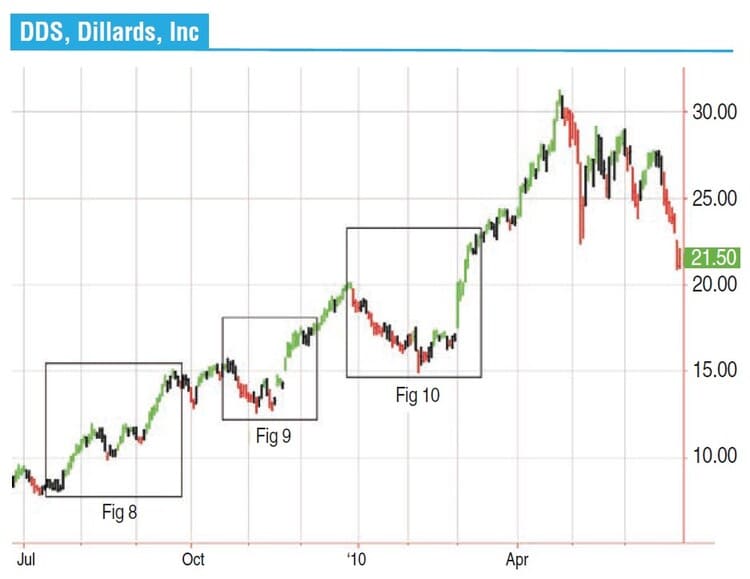
By comparison, Figure 7, Dillard’s Inc. (DDS), over the same period, is 37% noise. DDS moves strongly both up and down. The swings are long and continuous, with few pauses.
Why is the noise percentage useful? The noise percentage tells us how continuous the price swings are. High noise percentages reveal prices that spend a large percentage of time overlapping in the same price range. Low noise percentages mean that most of the price bars are continuously moving up or down. Looking for stocks with low noise percentages can, theoretically, help narrow the search for active, tradable stocks.
When looking back one year, most stock price patterns are between 40% and 50% noise. When measured on shorter time frames, the noise percentage can vary widely. When displayed over very short time frames (less than 10 days), the noise percent can vary from zero percent to 100%. Further study into the percentage of noise may be fruitful for the individual trader. With so many of the price bars being noise, no wonder it is so hard to find a useful signal!
Suggested Books and Courses About Trading Charts


USING NOISE TO AID TRADING
Let’s say our strategy is to buy a stock on a pullback and try to make a 10% profit. We would buy at a slightly depressed price (the pullback) and hold until the stock hit our 10% target price. Understanding when the price is moving versus when there is only noise can help us decide when to enter and exit the trade.
If we want to enter the trade on a pullback, what we really want to do is enter at the end of the pullback, not while the price is still falling. We want to enter when the price indicates it is done falling and may be ready to turn up. In the terminology of the Clear method, we want to follow the HL down each day during a down swing. If the high continues to move down, we wait because the down swing is continuing. If we have a noise bar, that noise bar is our alert to the possibility of a turn upward, but we still wait. When we eventually see the first day of a new up swing, we have our first opportunity to decide if we want to enter.
When looking to exit, we want to make our 10% gain. Actually, what we really want is to make our 10% and then stay with the trade until the upward move is done. In the terminology of the Clear method, we wait for our 10% and then stay with the trade as long as the LH continues to rise. When we see the first noise bar, we can decide if we are ready to exit the trade. Three examples of this technique can be seen in Figures 8, 9, and 10. These three figures are selected from the price series for DDS shown in Figure 7.
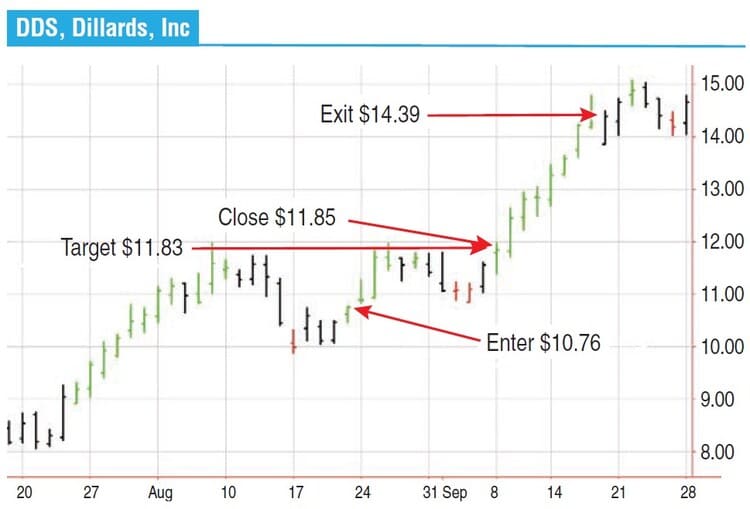
Figure 8 shows DDS from July 17 to September 28, 2009. During late July and early August, the price is on a strong up swing. In mid-August there are four noise bars. On August 17, 2009, we see the start of a brief down swing. After three noise bars a new up swing begins on August 21. We enter near the end of the day at $10.76. We are looking for a 10% gain, which is a target price of $11.83. On September 8, the price closed at $11.85. If we had exited at the end of September 8, we would have made our 10%. However, by continuing to follow the HL, we stay with the trade. On September 18 we have our first noise bar, showing that the price is pausing. We exit at the end of the day at $14.39, a gain of 33.7%.
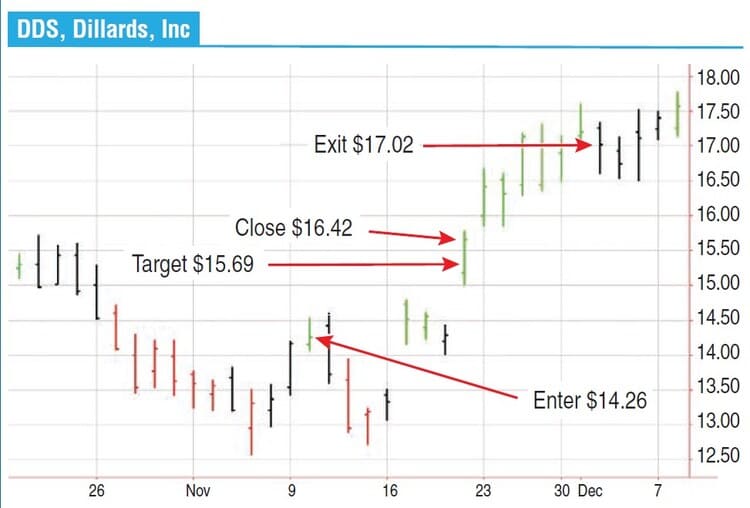
Figure 9 shows DDS from October 20 to December 8, 2009. As you can see, during the latter part of October and early November the price is swinging down. We follow the down swing through the noise around November 9, until we see the first bar of the up swing on November 10. We enter near the end of the day at $14.26. Our 10% target is $15.69. A few days after we enter, the market drops and we are down -8%, but about a week later, on November 23, the price closes at $16.42. If we had exited there, we would have made about 15%. But by following the HL, we continue to follow the up swing as the lows rise until we find the first noise bar on December 2. We exit at the end of the day at $17.02 with a gain of 19.3%.
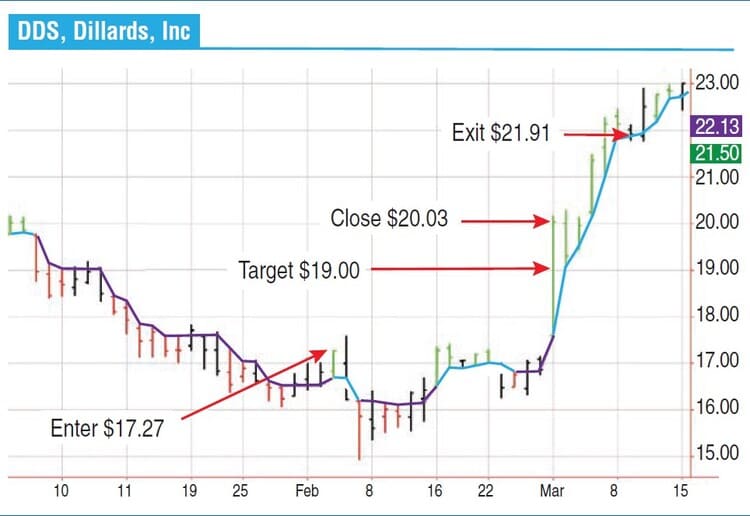
Figure 10 shows Dds from December 28, 2009, to March 15, 2010. From late December 2009 through January 2010, the price is on a down swing. We follow the down swing until we see the change to an up swing on February 3. We enter at $17.27, making our 10% target $19. The price blasts through $19 on March 1, 2010, with a close of $20.03. If we had exited there, we would have made almost 16%. Following the HL, we stay with the trade until the first noise bar on March 9. We exit at the end of the day at $21.91, a gain of over 26%.
Noise can help us in two ways. Before we enter the market, noise can alert us to the possibility of a change in swing direction. When the noise has stopped and we see the start of a new swing direction, we may choose to enter the trade. When we are looking to exit a trade, we can stay with the trade until we see a noise bar, which alerts us that the directional move is pausing. At that point we may choose to exit.
CAVEAT
If we had taken all three of these DDS trades, we would be up nearly 100% in about seven months. If only trading were this easy! Charts that shoot up 200% to 300% are very rare. Not only that, finding three outstanding trades in a row is even rarer. Don’t expect instant success. Trading is difficult and requires study. The purpose of this article is to explain the value of directionality and noise, not to advocate any specific trading method. The methodology I’ve just explained (that is, to buy on a pullback and sell after 10%) is just one way to approach the market. The individual trader must work to find the best way to integrate the Clear method into his or her own trading style.
NOISE ALERT
The Clear method allows us to objectively interpret price action. Using the principles of the method we can identify when price is moving up during up swings, when price is moving down during down swings, when the swing direction changes, and when there is noise. Noise occurs when price is not changing. Most long-term price patterns are between 40% and 50% noise. When looking to enter a trade, we can use noise as an alert signal to watch for a favorable signal. When looking to exit a trade, we can use noise to alert us to a pause in price that we may choose to use as an exit signal. Just as price bars combine to show swings, swings combine to show trends. Curious traders might continue their research into this relationship between swings and trends.
Ron Black has been actively trading stocks and futures for more than 15 years. He has written statistical macros for Microsoft Excel and numerous indicators and strategies for TradeStation.