Trading Articles
Turtle Trading Building Blocks: Trend-Following System Rules
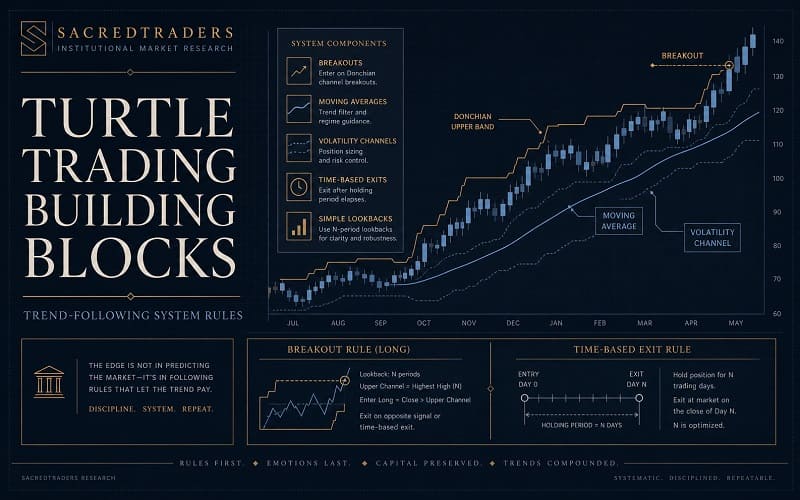
Let’s begin with a survey of many common trend-following building blocks, including the ones we were taught in the Turtle program. These are ways to determine when a trend may be starting and when it may have ended. This is not a complete survey: You can find entire books that do nothing more than outline different indicators and system rules that can be used to build trend-following systems. For other types of trading there are other types of building blocks that may be useful.
Building Blocks
Since this book (Way of the Turtle) is not a comprehensive treatise, however, I’ll leave the discovery of those tools as an exercise for the reader. The building blocks discussed in this chapter are the following:
- Breakouts: These are situations when the price exceeds the highest high or the lowest low for a specific number of days. This was the primary tool used in the original Turtle system.
- Moving averages: These are continuously calculated averages of the price for a specific number of days. They are called moving averages because they are calculated each day and their value therefore moves up and down with the new prices.
- Volatility channels: These are built by adding a specific amount of price to a moving average that is based on a measure of market volatility such as the standard deviation or ATR.
- Time-based exits: These are the simplest possible exits: You exit the market at a specific, predetermined time (e.g., exit the market after 10 days or after 80 days).
- Simple lookbacks: These involve a comparison of the current price with a historical price at some earlier period.
We will explore each building block in more detail and demonstrate how it can be used in a trend-following system.
Breakouts
Earlier in the book I discussed breakouts and showed how they have an edge. A new high price is a strong indicator of the possibility that a trend is beginning. The number of days used to calculate the highest high or the lowest low for the breakout will determine the type of trend you may be entering. Fewer days will indicate the possibility of a shorter-term trend. A large number of days will be more indicative of the possibility of a longer-term trend. Breakouts work especially well when they are combined with other indicators of overall trend, such as the Donchian Trend system, which uses breakouts for both entry signals and exit signals and moving averages to indicate the overall trend.
Moving Averages
Moving averages are continuously calculated averages of the price for a specific number of days. The simplest type of moving average, called a simple moving average, is the average of the price for a specified number of days. The 10-day moving average of the close is the average of the prior 10 days’ closes, and a 70-day moving average of the high is the average of the previous 70 highs.
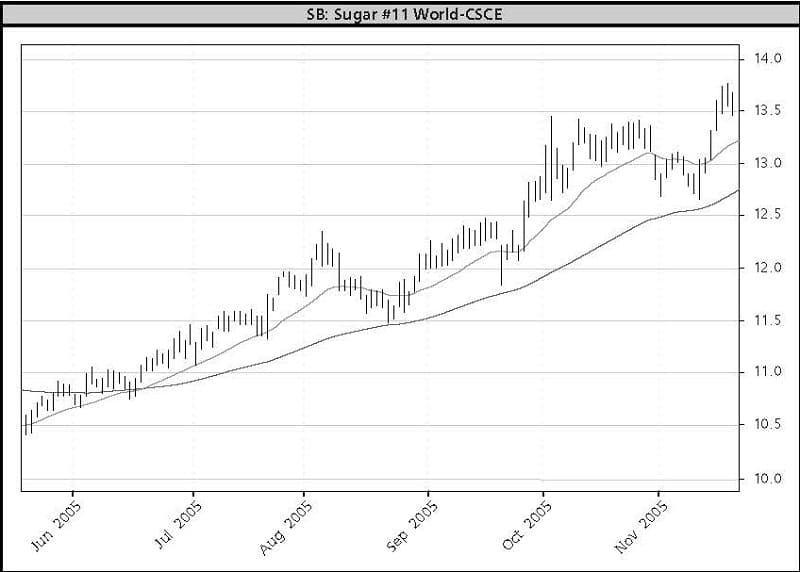
There are other kinds of moving averages that are slightly more complex, the most common being the exponential moving average. This is an average that is computed by taking a portion of the previous day’s average and mixing it with a portion of the current price. Figure 9-1 presents two moving averages: a 20-day exponential moving average and a 70-day exponential moving average.
Advanced Books and Courses on Algorithmic & Quant Trading


You can see how the 20-day moving average follows the price more closely and how it crosses the longer-term moving average in mid-June, indicating the start of an up trend. This is a very common system entry: A trade is taken in the direction of the shorter moving average when it crosses over the longer moving average. In this case, a long trade would have been initiated in early June at the point of the crossover.
Many other different types of moving averages have been proposed by system designers and researchers. Most of the additional complexity offered by their designers is not all that useful in actual practice and presents a greater potential for curve fitting and unrealistic test results. This potential pitfall is considered in greater detail in Chapter 11 of Book.
Volatility Channels
Volatility channels are good indicators of the beginning of a trend. If the price exceeds a particular moving average plus some additional amount, this means that the price is going up. In other words, it indicates that a trend possibly has begun. We will examine two different systems built on volatility channels in Chapter 10.
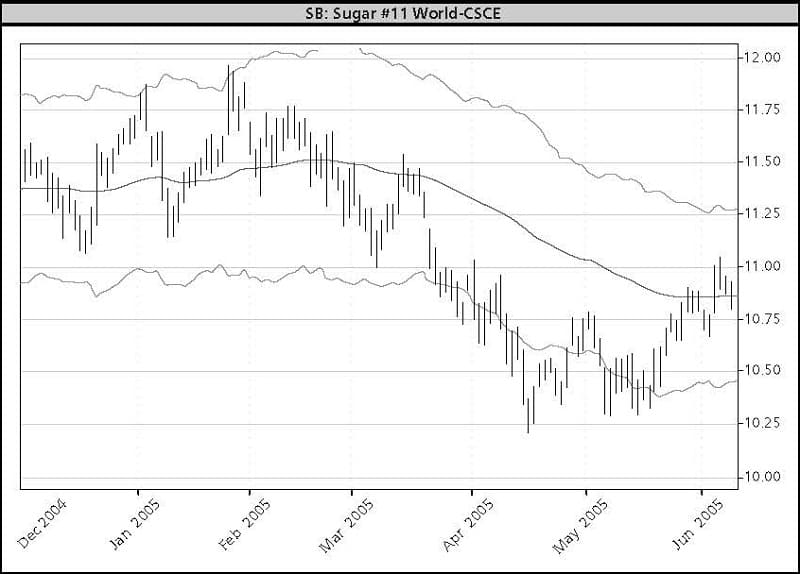
Figure 9-2 shows an 80-day moving average with a volatility channel plotted both above and below the moving average. You can see from the graph that the prices remain inside the channel for the most part except in the right-hand part of the graph, when they descend below the channel. You also can see how the moving average slowly turns down and follows the prices as they go lower.
Time-Based Exits
A simple time-based exit can be very effective and useful. It also can help smooth out the drawdowns associated with a breakdown in a trend. This is the case because very often a time-based exit occurs before the drawdown is revealed by a moving average or breakout, both of which follow price more closely.
Simple Lookbacks
If you consider at a very basic level what trend following is, you can devise even simpler mechanisms for determining the potential start of a trend. One method that works reasonably well is to simply look at a price some number of days earlier. You can add those prices by using a volatility-based measure such as ATR. For example, you can buy if the prices exceed the price 100 days ago by 2 ATR. Chapter 10 will explore some systems that use other types of simple lookbacks.
Want More?
Over the years, hundreds of different types of indicators have been invented. Recently, advances in technology have made it easier for traders to program their own formulas and create their own indicators, and trading magazines publish new indicators and systems built on those indicators in each new issue. For those who want to learn about other indicators and system building blocks in more detail, some sources are included in the bibliography. However, before you dig in too deeply, here are some words of advice. I’ll use trend following as an example, but this advice applies to other types of trading as well.
If a market starts to go up, sooner or later it will trigger a long entry signal using any of the trend-following building blocks. All the building blocks can be tuned so that they react more quickly or more slowly. Therefore, in effect you can use any of them to build systems that will perform similarly to systems built with other building blocks.
My advice is that there are better ways to spend your time than searching for the perfect newfangled nuclear-powered indicator that works perfectly in past years’ markets. I suggest that instead you try out some simple systems that use the basic building blocks that were outlined above. We will look at some of them in Chapter 10.
- Part of Book: Way of the Turtle By Curtis Faith