Trading Articles
Tops And Bottoms By Alexander Sabodin
When head & shoulders, double-top/bottom, and triple-top/ bottom patterns are discussed, you’ll find that they are referred to as trend reversal patterns. A triple top or bottom is rarer but is really just a version of the head & shoulders pattern. The main difference between the two is that all three peaks (or three troughs) of a triple top or bottom are located at almost the same level. In the event there are two peaks (or troughs), it’s referred to as a double top (or double bottom), respectively.
Often, you’ll find technical analysts having differing opinions about the type of price pattern that’s formed. Some may say it’s a head & shoulders pattern, while others may call it a triple top. This argument is academic, because at the core, both price models are virtually the same. A famous satirist remarked that a woman once asked him why chicken bouillon cubes are called cubes, when they are really parallelepipeds. That sounds funny, doesn’t it? When it comes to price patterns, the situation is quite similar. As technical analysts, our challenge lies in understanding the core of the price models and the way we can profit from them, regardless of what the price model is called.
The Double Top
I will consider the features of these models using the double top as an example, since this reversal model occurs most frequently. Please refer to the weekly chart of the Eur/usd in Figure 1. In an ascending trend, what happens is that price establishes a new maximum (point A). This is usually accompanied by an increase in trading volume. Then there is usually an intermediate fall (point B) with declining volume. So far, everything has gone as you would expect in a typical rising trend.
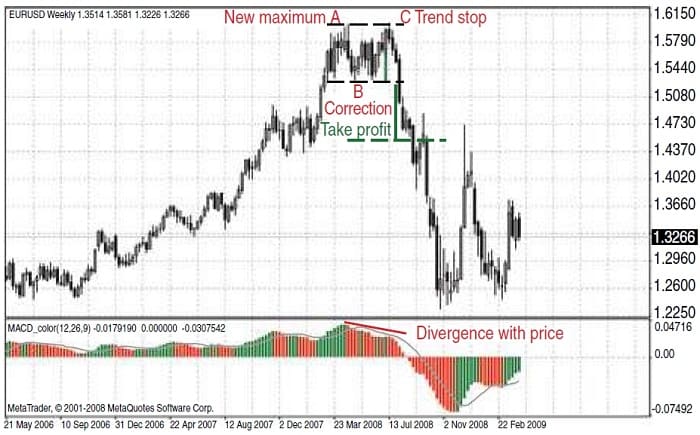
During the next rise (from point B to point C), price does not manage to go above the level of the previous peak at A. Prices start falling, and as a result you have a potential double-top formation. I say potential because, as is the case for all reversal models, the reversal is not complete until you are sure that the closing prices cross below the previous support level, or go below point B. Until then, it is premature to consider this to be a trend reversal pattern. It could well be just a consolidation horizontal phase, after which the previous trend will continue developing. Ideally, the top of the head & shoulders model should have two clearly outlined peaks located at approximately the same level. As a rule, the first peak is usually accompanied by an increase in trading volume, while the second peak has less volume.
Suggested Books and Courses About Market Indicators


The vigorous breakthrough of prices falling below level B between the two peaks with increasing volume in the first peak and decreasing volume in the second peak is enough of a confirmation that the model has completed, and it is likely that there will be a trend reversal. The possibility of prices moving back toward the breakthrough level is not discarded. After prices move up to the breakthrough level, the descending trend is likely to continue to develop.
THE CORE OF THE DOUBLE-TOP MODEL
- 1 A stop in upward price movement
- 2 Reversal in price movement
Is It a Double Top/Bottom?
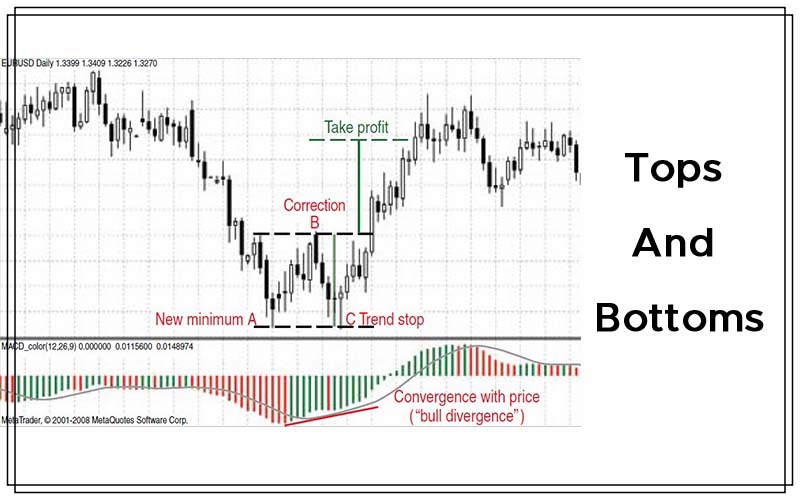
The measurement of the double top is based on its height or the width of the channel that is formed by the model. Prices are likely to fall from the breakthrough point (point B) by the amount of the height of the formation. This will be your profit-taking point. Similar to the formation of the head & shoulders model, an oncoming reversal is indicated when there is a divergence between price and an oscillator. In Figure 1, I have included the moving average convergence/divergence (Macd) histogram oscillator.
It’s not worth your time to get discouraged by the markets.
What I have discussed so far is the theoretical double-top formation. In reality, what happens in the market is a deviation of this ideal price model, and reversal models are no exception. It may just be the case that both peaks do not appear at the same level. Assume that the level of the second peak is not as high as that of the first. Does that make it a double top? Realistically, this means that the ascending price movement stops, for now anyway, after the second peak. Therefore, it is logical to consider such a price model as a double top.
What if the second peak moves higher than the first one? Is it still a double top? To answer this question, I will apply the price filter, which is the closing price of the second peak. Since I use candlestick charts, if the candle shadow of the second peak exceeds the first peak, but the closing price (candle body) is not higher than the first peak, it implies that the upward price movement has stopped. If the candle body in the second peak exceeds the level of the first peak, it is not considered to be a top. What happens here is a break-through of the resistance level.
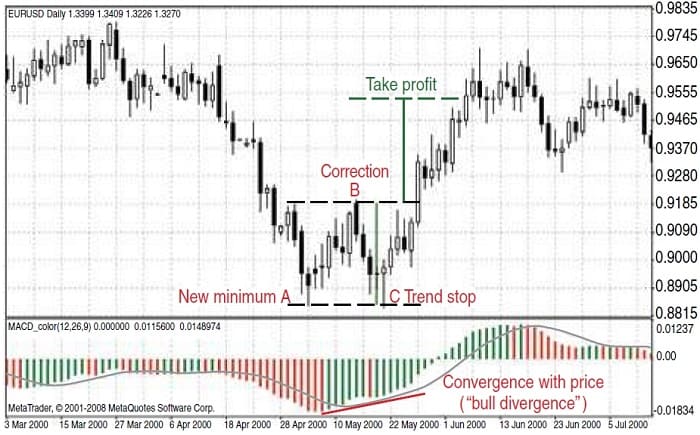
The case for double bottoms is the converse of double tops. On the daily chart of the Eur/usd in Figure 2, note that point C is a little lower than point A. But since this is just the candle shadow, and the closing price has remained above the level of the previous trough, you can assume that it is a chance tick and not a breakthrough of the previous support level. Therefore, it is safe to assume that a double bottom has formed and you can determine your profit-taking point.
As you know all too well, there is always some element of chance in the market. It is probable that in the last segment or wave of a bull market, prices will set a new maximum and start moving in the opposite direction. In such a case, the last upward breakthrough is considered a bull trap, which can be the cause of a lot of discouragement for market participants. But is it worth going through all that?
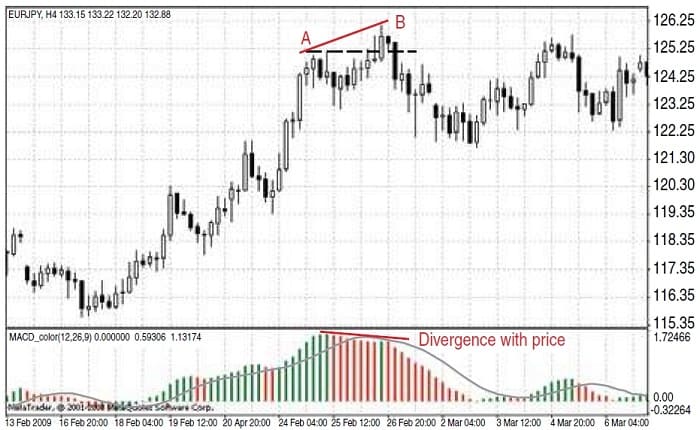
In the four-hour chart of the Eur/Jpy in Figure 3, note that at point B price exceeds the previous peak that was formed at point A. It is obvious that the resistance level has broken through, but what is not clear is whether a double top has formed. Shortly after the breakthrough of the resistance level, prices began falling. Here is an example of why it is a good idea to add an oscillator to your price chart. Note the divergence between price and the Macd oscillator. This divergence could be your signal that prices will fall in the near future. It’s not worth your time to get discouraged by the markets. There are enough signals out there that can prevent you from falling into that bull trap.
Alexander Sabodin is a consultant for Alpari in Ukraine.