Trading Articles
Timing the Markets: A Method Based on Time Cycles and Structural Analysis
First, I would like to say that it was Gann (not Mr. Ferrera) who said to measure time by the Sun based on harmonics of the circle. He said to add these time periods as days, weeks and months from extreme high and low levels to determine future turning dates. Mr. Ferrera did not invent this technique, he simply illustrated the approach as one of the methods in the book to make it more accessible to Gann students.
Secondly, this timing method was not intended to be any kind of trading system by Gann or Mr. Ferrera. It simply gives you points in time that could result in a change of trend, you still have to know how to trade to make any use of the methodology for practical benefit.
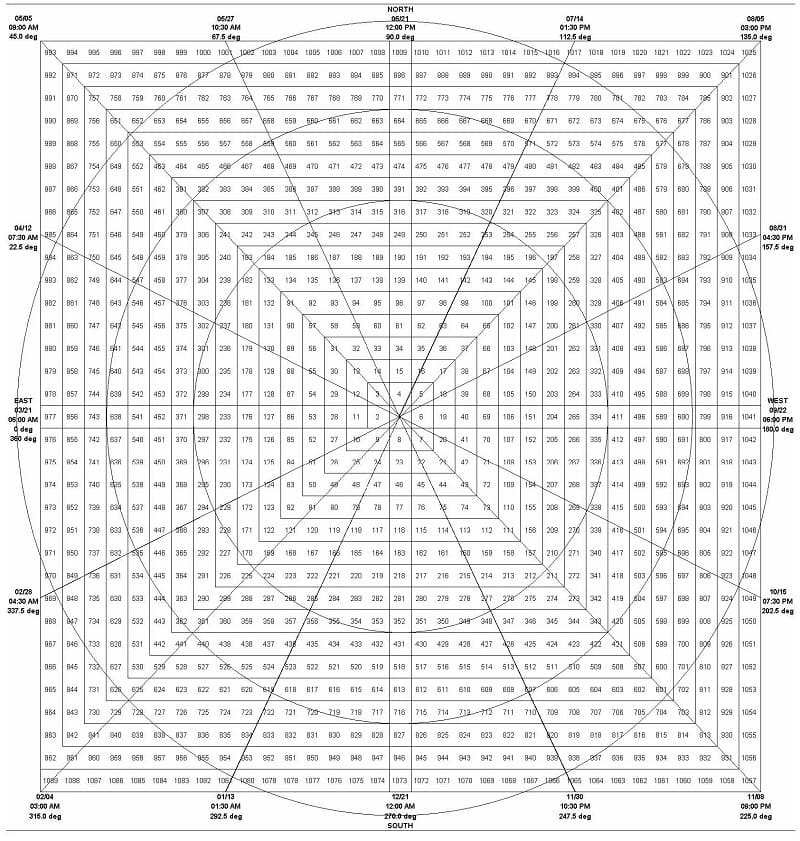
“Man first learned to record and measure time by the use of the Sun dial, and by dividing the day into 24 hours of 15-degrees in longitude. The “reflection” of the geometrical angle on the Sundial indicated the time of day. Since all time is measured by the Sun, we must use the 360 degrees of the circle to measure time periods for the market, but remember, you must always begin to count time is days, weeks and months from extreme high and extreme low levels, and not from exact seasonal or calendar time periods.
45 days is 1/8th of a year, 90-degrees is 1/4th of a calendar year, or a square. 112½ days is 90 + 22½. 120 is 1/3rd of the circle and is a triangle. 135 is 90 + 45, 150 is 90 + 60, 157½ is 135 + 22½, 165 is 120 +45. 180 is ½ of a complete circle or opposite to 0, the starting point. Very important for a change in trend. 202½ is 180 + 22½, 225, a 45-degree angle is 180 + 45. 240, a triangle is 2 times 120. 247½ is 225 + 22½. 270 is ¾ of a circle and 3 squares of 90. 292½ is 270 + 22½, 315 is 270 + 45, 337½ is 315 + 22½ and 360 degrees is the complete circle. You measure weekly and monthly time periods in the same way as you do the days and watch all of these important time angles for a change in trend. —-W.D. Gann Master Egg Course.
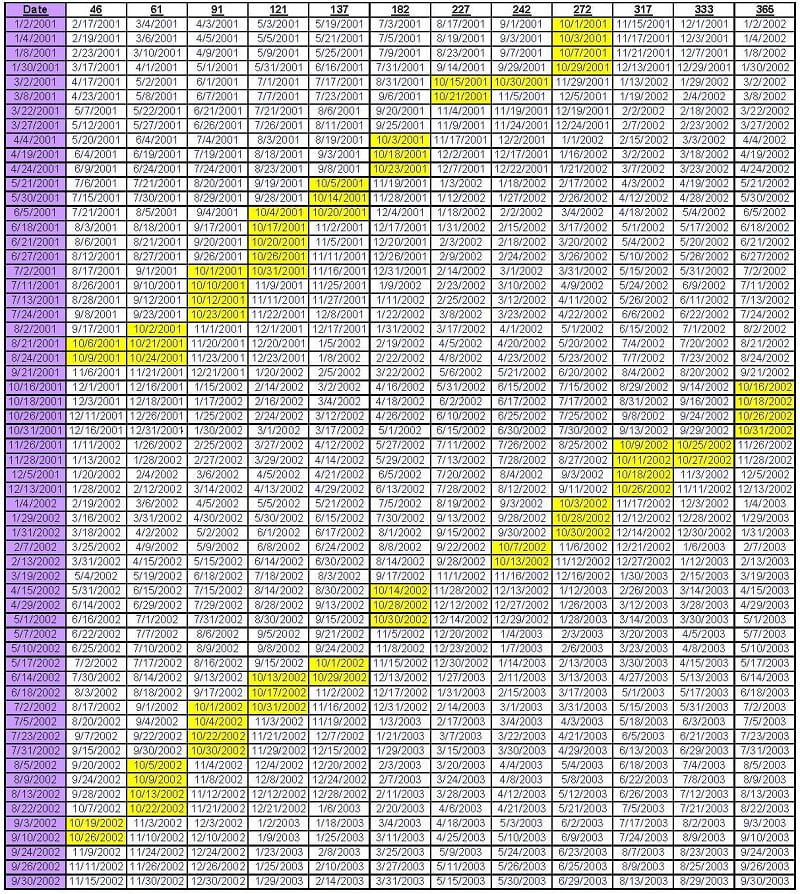
Using the Technique as described in Mr. Ferrera’s Book, I used turning points from only the past two years, i.e. January 2001- to present. I also used a close only chart with a 2%-minimum swing filter to identify the past turning dates. Following this approach, I have identified the following “cluster” dates for October 2003 after eliminating non-trading days, i.e. weekends.
October 1st
October 3rd
October 9th
October 13th
October 20th
October 24th
October 27th
* The close of the Month (i.e. the 31st) also has a group of hits, but the 27th seems to be the more likely time.
Advanced Books and Courses on W.D. Gann Methods


A picture of the Excel dates and results are on the following page.
HOW TO DIVIDE THE YEARLY TIME PERIOD
Divide the year by 2 to get 6 months, the opposition point or 180 degree angle, which equals 26 weeks.
Divide the year by 4 to get the 3 months’ period or 90 days or 90 degrees each, which is ¼ of a year or 13 weeks.
Divide the year by 3 to get the 4 months’ period, the 120 degree angle, which is 1/3 of a year or 17-1/3 weeks.
Divide the year by 8, which gives 1 ½ months, 45 days and equals the 45 degree angle. This is also 6 ½ weeks, which shows why the 7th week is always so important.
Divide the year by 16, which gives 22 ½ days or approximately 3 weeks. This accounts for market movements that only run 3 weeks up or down and then reverse. As a general rule, when any stock closes higher the 4th consecutive week, it will go higher. The 5th week is also very important for a change in trend and for fast moves up or down. The 5th is the day, week, month, or year of Ascension and always marks fast moves up or down, according to the major cycle that is running out.