Trading Articles
The Thorn At The Bottom By Alexander Sabodin
Here’s a reversal pattern that occurs frequently but is difficult to discern during its formation. The thorn pattern is encountered quite frequently, but it is difficult to discern while it is being formed. Unlike other reversal models, which reflect gradual changes in trend dynamics, the thorn is a sharp jerk of the price in a given direction, immediately followed by a jerk in the opposite direction without any pause. Thorns often appear in low-liquid markets or after a news release.
The reason behind such a situation can be attributed to the psychology of market participants. At a certain time, market participants get overwhelmed with emotions and they trade according to “the greater fool theory” — they pay a lot and hope to meet a greater fool who will pay them even more. It looks like network marketing; the last one who joins the movement loses. All logical calculations made in a quiet room before placing that trade are completely forgotten and irrational decisions come to the forefront.
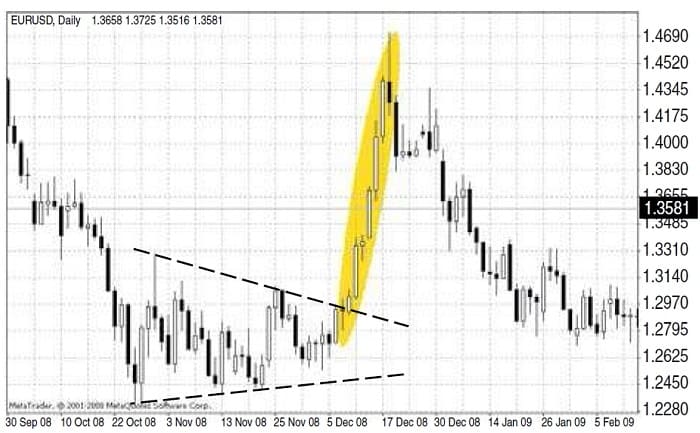
In the case of a thin market — that is, one with low liquidity — the price movement develops with acceleration, similar to what you see with the Eur/usd in Figure 1 on December 24, 2008. Looking at the chart, you would think that the situation was beyond control. The market surpassed all conceivable and inconceivable expectations. An experienced trader knows that you need to keep alert during such situations. Any trader will dream of riding the lead horse during this wild gallop. However, at some moment in the course of a trend development, even the most inexperienced trader may suddenly feel that something is wrong, so a comparison to riding a tiger may be more suitable. It is not enough to catch a tiger and climb it. It is more difficult to dismount the tiger without losing your face and keeping your hands and legs safe and sound.
Recognizing The Thorn
First, always pay attention to the angle of movement. If the incline of the trend or the angle of the trendline gets unnaturally steep, it means that the movement is accelerating, but on the other hand, it could be clear evidence that the market is possibly overheating. This, in turn, increases the probability of a correction. If you have a position already opened, you may want to use protection stop signals and implement your stops.
Second, if the thorn in the price chart appears after the release of some unexpected news (the “news thorn”), it always defines the trend direction. A news thorn against the trend provides a good opportunity for opening a position with the trend. This is usually done by experienced traders, unlike those who are just budding, who are frequently deceived by such false movements against the main trend, forgetting the classic phrase that “the trend is your friend.”
Suggested Books and Courses About Candlestick Patterns
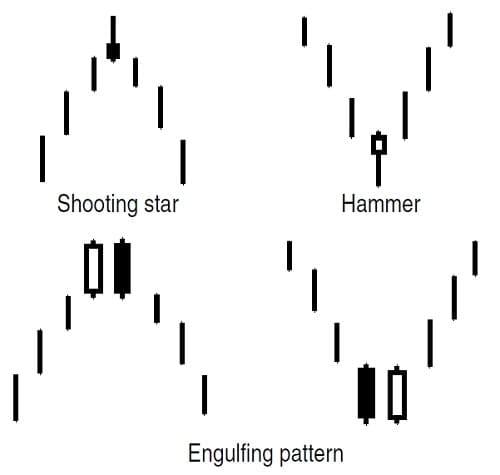
Third, you can see on the chart that the thorn can be discerned after the formation of candle reversal patterns such as the hammer, shooting star, and engulfing patterns. Anyone familiar with Japanese candlestick analysis will recognize these names.
Shooting Star
The shooting star warns of a possible stop in the acceleration of price. A shooting-star body is small and located in the lower part of the candle price range; the upper shadow is long and the lower shadow is small, or it does not exist at all. The color of a shooting-star body does not have any determining value. However, the signal becomes stronger if the body is bearish. The candle displays that the trading session opened near the minimum, after which the price flew upward and fell down again, which is why the closing price approached the opening price. In other words, the price growth during the trading session turned out to be false.
Hammer
A hammer often appears right before the end of a downward slide in prices. A hammer body is relatively small, located in the upper part of the candle price range. The lower shadow is long, and the upper shadow is small or absent. A hammer body color does not have any determining value. However, the signal is stronger if the body is bullish. If such a candle signal appears during a descending trend that is prevailing in the market, it means the trend has come to its end.
Bullish And Bearish Engulfing Patterns
The hammer and shooting star are individual candle bars, which, as indicated, send important signals about the state and health of the market. However, most of the signals emerging in Japanese candle charts are not based on individual candles but on a combination of candle bars. One such combination is the engulfing pattern. This pattern is very relevant to the thorn since it is a reversal signal that usually forms at the end of the thorn (Figure 2). It is formed with two candles with bodies that contrast in color. The second body must engulf the first one (shadows can be engulfed, but it’s not necessary).
Price models reflect mass human psychology, which does not change over the years.
In a market, a bearish engulfing pattern emerges when the second bear candle body is engulfed by the first bull candle body. The bullish engulfing pattern appears at market bases when the second bull candle body completely overlaps the first bear candle body.
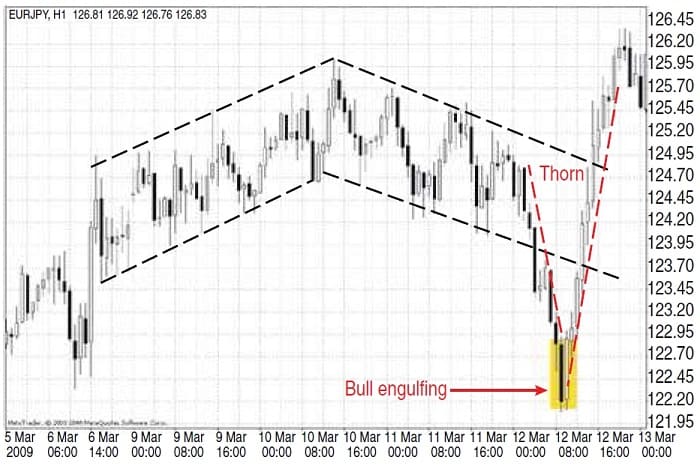
A Thorn At The Bottom
After the formation of the thorn model, as a rule, the price vigorously returns to where the price movement started to rise or fall. A rushed fall is strengthened by those who are trapped at the top of the market. They turn themselves inside out in an attempt to eliminate their losing positions. Moreover, there are no support levels in their way. Figure 3 shows what the situation would be if the market went amok after prices broke below the lower line of the channel. This unnaturally steep trend angle signaled the appearance of the thorn, after which a bullish engulfing pattern emerged, marking the bottom of the market. Note that prices returned to where they started from quickly.
One thing you must remember when trading with the thorn is that not every vigorous movement such as this implies that a thorn is going to form. Sometimes after a vigorous rise or fall there is a pause in the price movement, after which the trend continues. Trend continuation models, which I will discuss in future articles, can help recognize such a situation.
Mo Magic Wand
I would like to conclude my discussion of some of the main reversal models by saying that changes in trend dynamics can never take place in one quick movement, as if a magic wand were waved over it. Another point I would like to make here is that it is worthwhile to remember that changes in trend dynamics never occur as quickly as they do in the thorn. When there are changes in the market that are of a relatively large magnitude, there is usually some transient period, but such changes are not always followed by trend reversal. Sometimes they may imply a pause or consolidation, after which the existing trend development will continue.
In such situations, price models are very useful in analyzing the current market situation and help forecast the trend’s future direction. Discerning price models, especially those that occur frequently in price charts, will make you a more powerful trader. As I have mentioned, price models reflect mass human psychology, which does not change over the years. So it is likely that models that have worked in the past will work in the future.