Trading Articles
The Spearman Indicator For Technical Analysis By Dan Valcu
This indicator is a very old statistical tool that even to this day helps determine trend strength and turning points. Here’s how to apply it to your trading. Technical analysis can be considered both a science and an art; patterns and chart reading represent the artistic component, while technical indicators help us analytically understand trend strength, buy/sell pressure, and divergences. There are perhaps thousands of technical indicators, but few seem to deliver real analytical power and differentiation in this increasingly crowded landscape, especially since many can be perceived simply as intellectual exercises that produce little bottom-line impact.
To narrow down this set of tools, statistics offer a great source of established knowledge for those who want to focus on more tangible and useful indicators. For instance, the tried-and-tested Z-score has become a classic in both statistics and technical analysis. In this article we will discuss an established concept in statistics originally proposed in 1904, with potential for use in technical analysis: the Spearman’s rank correlation coefficient, also known as the Spearman indicator.
SPEARMAN’S RANK CORRELATION COEFFICIENT
Charles Spearman was a late 19th-century and early 20th-century British psychologist and mathematician with major contributions to factor analysis, theories of intelligence, and mental test theory. In 1904, he developed a statistical measure for the strength of association between two variables. It later became the foundation of the rank correlation coefficient bearing his name. Spearman’s rank correlation coefficient computes the degree of correlation between the ranks of the elements in two data groups of equal size.
Now, let’s assume that two data groups are each composed of N elements (N = 10). The lowest-value element in each group receives the lowest ranking. Then the next-lowest element gets the second-lowest ranking, then the next, until we reach the highest element in each group that gets the highest ranking. After this exercise, we are left with the original two data groups and two additional groups containing the ranks.
Correlation can be determined between the ranks of the two groups using Spearman’s rank correlation coefficient ρ (rho):
Where:
n = number of values in each data group (must be same for both groups)
di = difference between the ranks xi – yi of corresponding values Xi and Yi
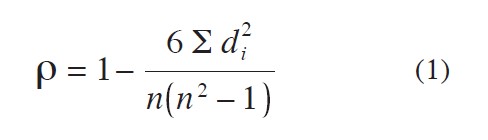
The coefficient varies between -1 (strong negative correlation) and +1 (strong positive correlation). Values of ρ in the proximity of zero indicate a lack of rank correlation. For our discussion, we will refer to this as the Spearman indicator.
QSTICK AND THE PSYCHOLOGICAL LINE
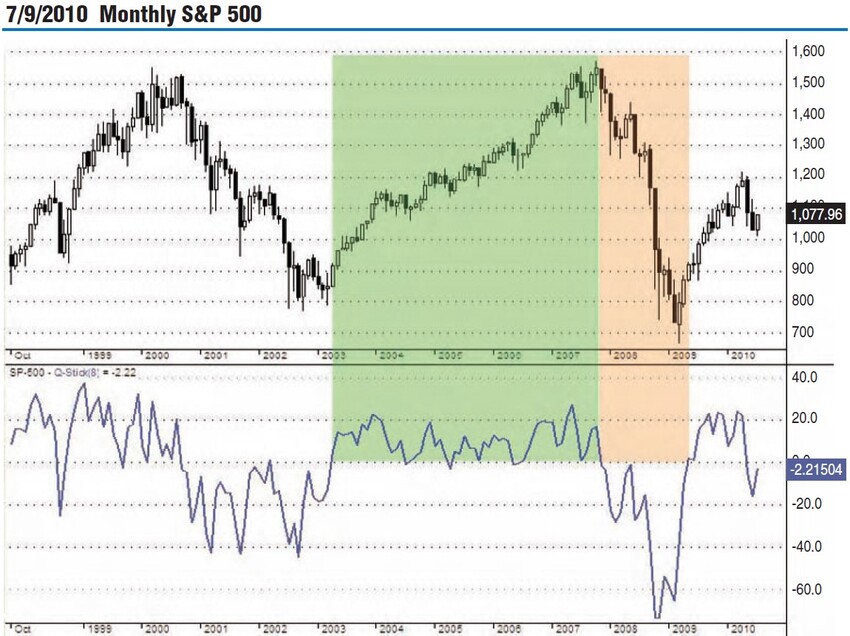
Everyone in technical analysis strives to determine and follow trends in the markets. Before we discuss the Spearman indicator, let’s focus on two lesser-known indicators used to identify trends and exhaustion points: Qstick and the psychological line. Tushar Chande’s Qstick (Figure 1) is a simple but useful indicator to quantify buying and selling pressure during a time period of N bars. More specifically, it is a moving average of the difference between close and open prices within a suggested eight-bar period. A positive indicator value demonstrates buying pressure as more bars have closing prices higher than the open during the period. On the other hand, a negative Qstick shows selling pressure since a majority of the N bars have closing prices below the open.
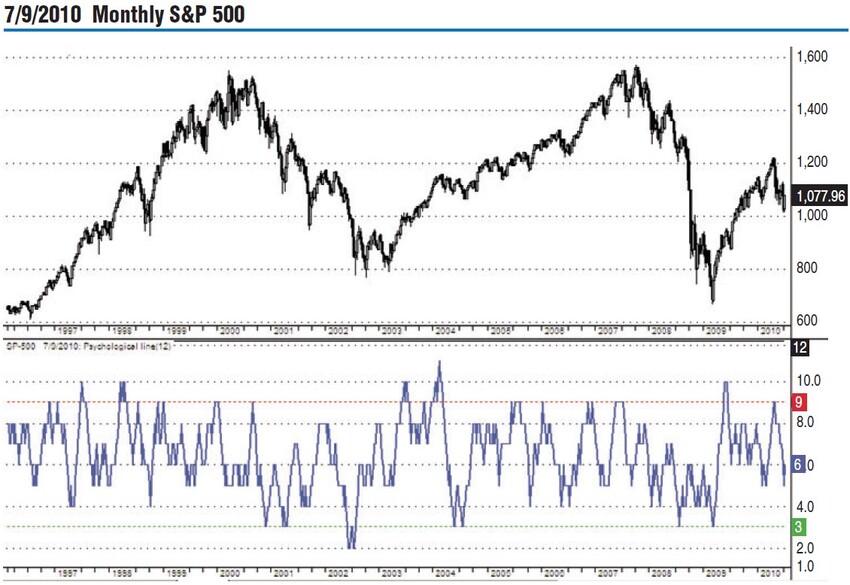
The psychological line is another straightforward indicator primarily used by Japanese technicians. It determines how many times price rises and falls during a time span of N bars. A very high psychological line warns of an impending peak where traders should tighten their stops, while a very low value indicates a low in price and prepares the trader for a long entry. For example, for N = 12, a value of 9 is a warning for an approaching top and a 3 announces a low (Figure 2).
What do these indicators show? Qstick averages candlestick bodies to determine buying and selling pressure (trends, consolidations, turning points), while the psychological line counts price fluctuations and works with probabilities to determine turning points. Trends and exhaustion points using price rankings and rank correlation can be identified in another way.
TRENDS THROUGH PRICE RANKING
In Figure 3A, the data series consists of 10 elements in ascending order, ranging from 10 to 100 by tens. We can assume that these elements define a very strong uptrend: 10, 20, 30, … 100. The second table, Figure 3B, contains the same data series, this time in a descending sequence from 100 to 10, demon-strating a strong downtrend. Finally, the third table, Figure 3C, contains a mix of the 10 data elements suggesting a weak trend or even the lack thereof.
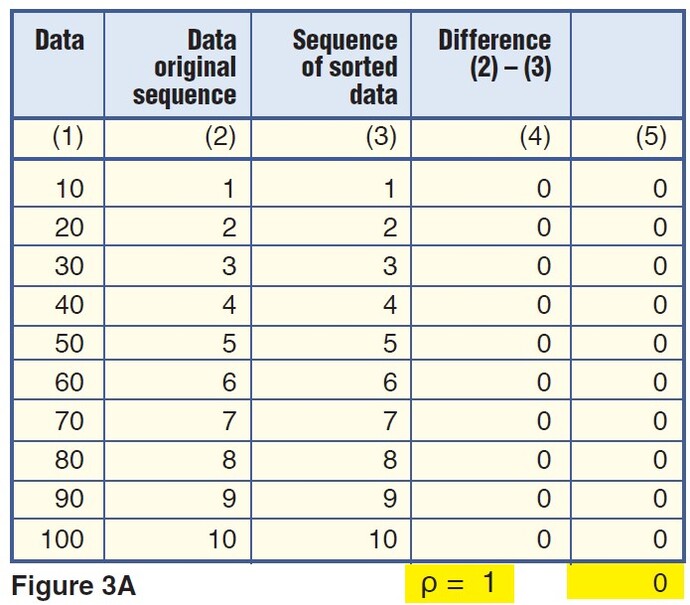
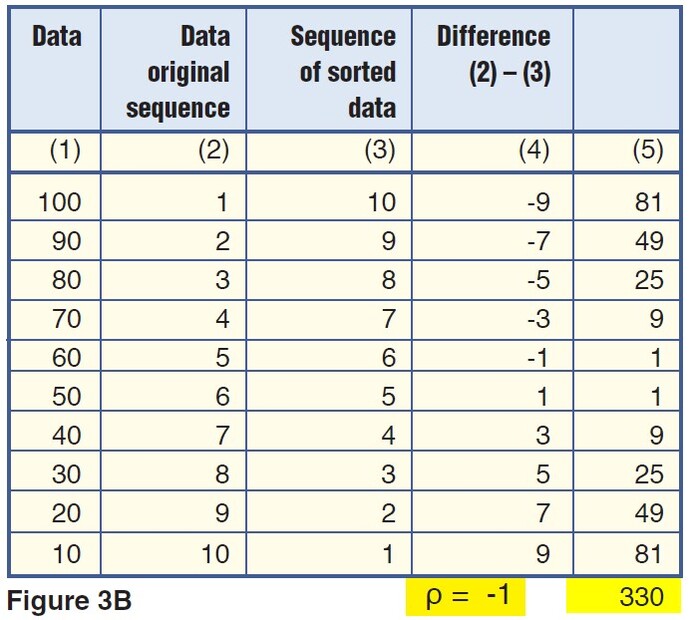
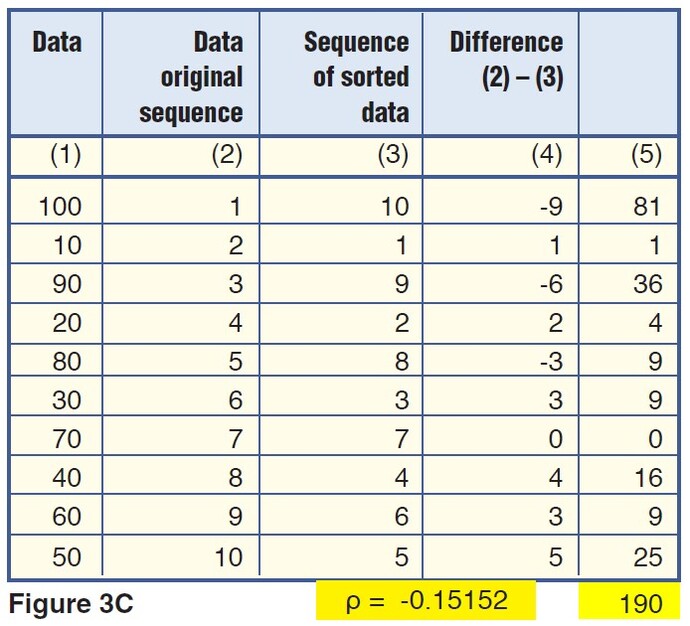
FIGURE 3: UNDERSTANDING TRENDS THROUGH PRICE RANKINGS. In Figure 3A the 10 elements define a strong uptrend. In 3B the elements suggest a strong downtrend and in 3C they contain a mix of 10 elements, suggesting a weak trend or lack thereof.
The key to these observations and the main idea behind the Spearman indicator lies in column 3, “Sequence of sorted data.” It contains ranks 1–10 for the 10 original elements, starting from lowest to highest. The lowest element (10) has the lowest ranking (1), while the highest element (100) has the highest ranking (10). Column 4 is the difference between ranks in columns 2 and 3 for the same element in column 1. The last column calculates elements in column 4 raised to the power of 2.
After applying the Spearman indicator, we get the following results:
- Figure 3A ρ = 1 (positive correlation), extremely bullish trend
- Figure 3B ρ = -1 (negative correlation), extremely bearish trend
- Figure 3C ρ = -0.15152 (no correlation), no trend
How can we use this statistical measure in technical analysis and trading?
SPEARMAN FOR S&P 500
The tables in Figure 4 contain three 10-day interval extracts from recent Standard & Poor’s 500 daily data: one with a strong uptrend, a second in a strong downtrend, and a third containing no trend. Each table has a computed Spearman coefficient as described in formula (1). What do we observe in these tables? First, the strong uptrend in Figure 4A has a Spearman coefficient equal to 0.987879, which confirms the strong positive correlation between the original ranks of the closing prices (column 2) and the rankings after sorting prices in descending order (column 3). The Spearman coefficient computed for data in Figure 4B is -0.95152, confirming a strong negative correlation between ranks and consequently, a strong downtrend. Finally, for the sequence in Figure 4C, the Spearman coefficient is -0.34545, which shows a weaker negative correlation between the ranks. In other words, it suggests the lack of a clear trend.
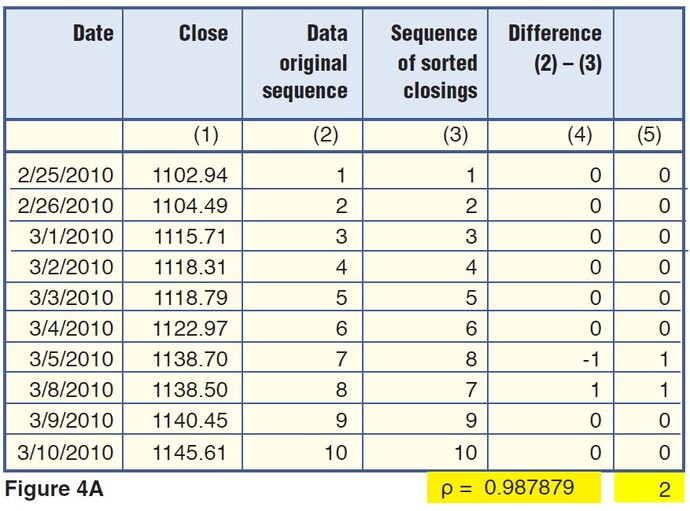
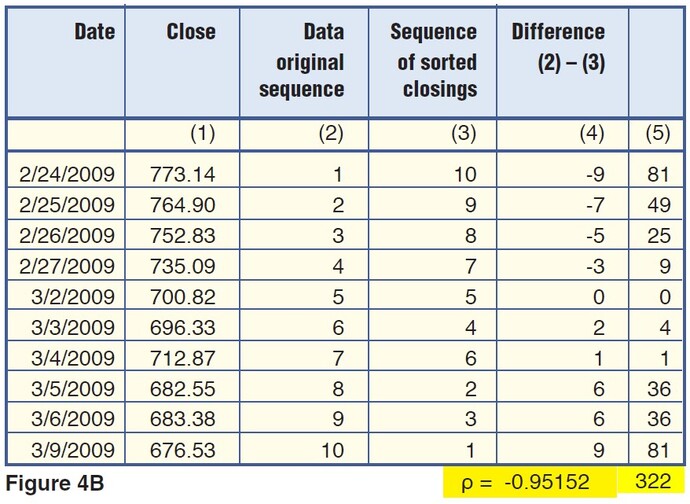
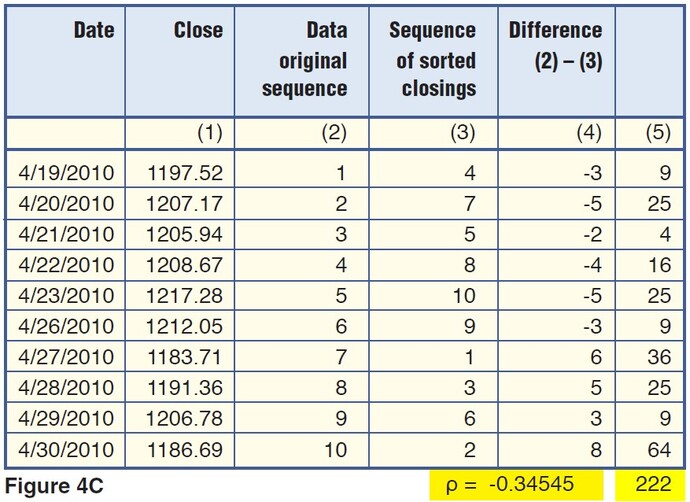
FIGURE 4: SPEARMAN INDICATOR FOR S&P 500. Here you see three 10-day interval extracts from S&P 500 daily data. In Figure 4A you see a strong uptrend, in 4B you see a strong downtrend, and in 4C, there is a lack of a clear trend.
USING THE SPEARMAN INDICATOR
The examples presented suggest that it may be possible to use the Spearman coefficient to determine trend intensity and turning points. I wrote a program using AmiBroker to calculate this indicator (“Amibroker Code For Spearman Indicator”).
Let’s first apply the Spearman indicator (10-bar period) to a daily Standard & Poor’s 500 chart with a 10-bar period (Figure 5). We see that values above +80 warn about possible tops, while values below -80 point to approaching lows. As with any oscillator, the Spearman indicator can remain above overbought (+80) and below oversold (-80) levels for longer periods of time when uptrends or down-trends are particularly strong. This indicator rarely records extreme values of +100 and ‑100. In those cases when it does happen, it is safe to bet against the existing trend (which happened on September 30, 1974; October 31, 1974; and April 29, 1983, if you look at a monthly chart of the S&P 500).
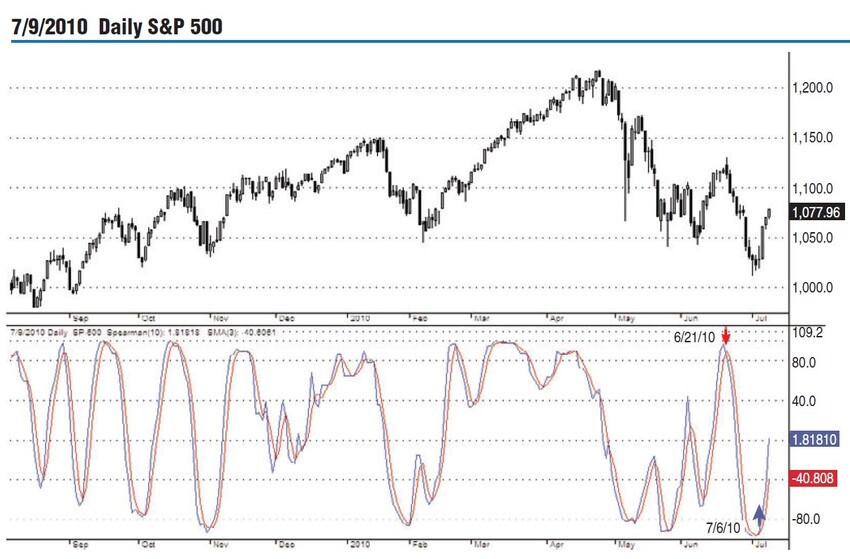
The crossings with the short moving average (three-day SMA) point to the end of trends and formation of minor or major turning points. On July 6, 2010, the indicator gave a first bullish signal when it crossed above its short-term moving average (in red). Confirmation of this move could have been taken either when the Spearman indicator or its SMA went above -80.
Suggested Books and Courses About Market Indicators

Another way to use this indicator is its position in relation to zero. Promising long entries are taken when the Spearman indicator crosses zero coming from below. On the other side, short positions carry a higher degree of confidence when the indicator falls below zero. A good deal of the trend can be lost, but the entries are more secure.
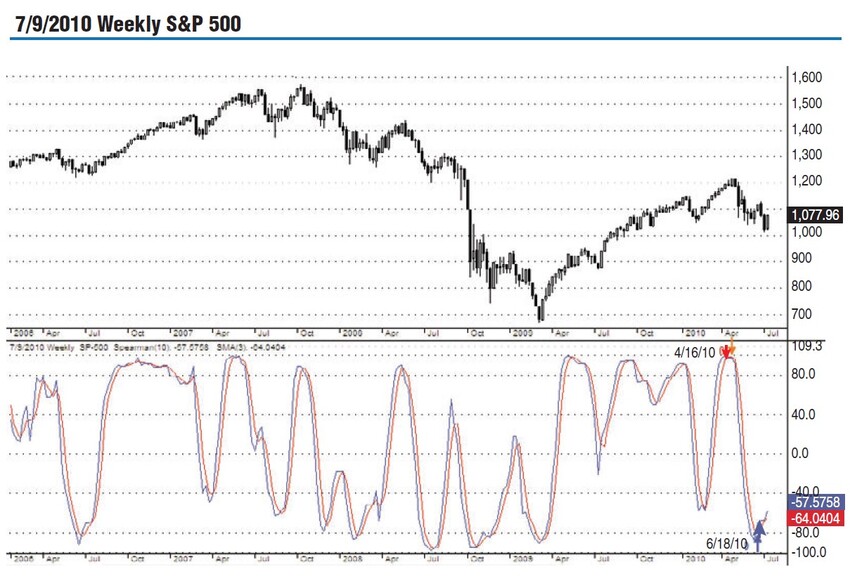
Figure 6 shows the same indicator and its three-day SMA on a weekly chart for the index. On June 18, 2010, their intersection gave a buy signal that until then had still been under water. Going back to Figure 5, very soon after, on June 21, there was a sell signal that invalidated the bullish view on the weekly chart. But if we look back on the weekly chart, we see that other crossings went far better. Nothing is 100% safe, and even this indicator should be embraced only with solid money and risk management rules.
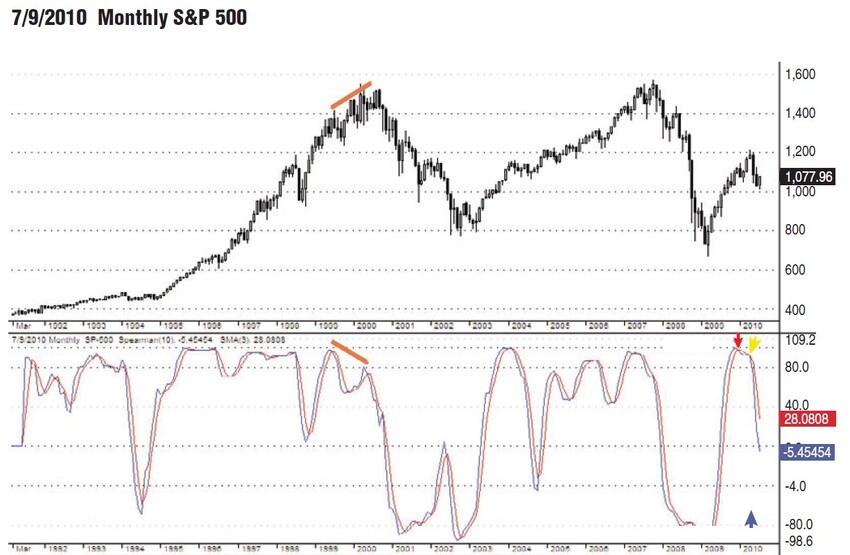
On the monthly chart in Figure 7, the Spearman indicator shows the S&P 500 in a bearish trend with a sell issued on January 29, 2010, and a hiccup moment on April 30, when both the indicator and its moving average were at 92.7273. The Spearman also generates divergences like the negative one with the index during the uptrend of 1999–2000.
As an oscillator, the indicator is well-suited for use with ichimoku charts. The resistance and support offered by the cloud can be confirmed when the Spearman crosses or hits very high or low values. Figure 8 shows an S&P 500 ichimoku chart with the Spearman indicator. As it stands now, the indicator and its moving average show that the index still has upside strength based on the indicator’s potential to reach +80. At that value, its advance will be capped by the resistance of the cloud at senkou span A.
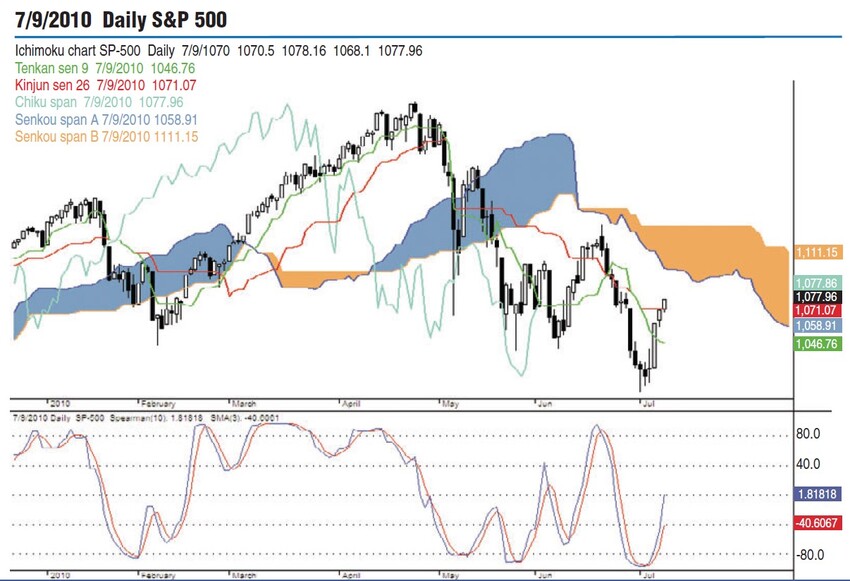
In early May 2010, senkou span B offered support getting a confirmation from the Spearman indicator, which reached -80 and turned up. Then in June, the rally failed close to the bottom of the cloud, with another topping confirmation from the indicator that reached +80.
SPEARMAN AND STOCHASTIC
Figure 9 illustrates the daily S&P 500 together with the Spearman indicator and the fast stochastic %K. For both indicators, we use a 14-day period with a three-day period for the averages in red. Even though the stochastic also comes as a slow indicator (%K and %D), we prefer to measure both indicators using their primary mode of calculation.
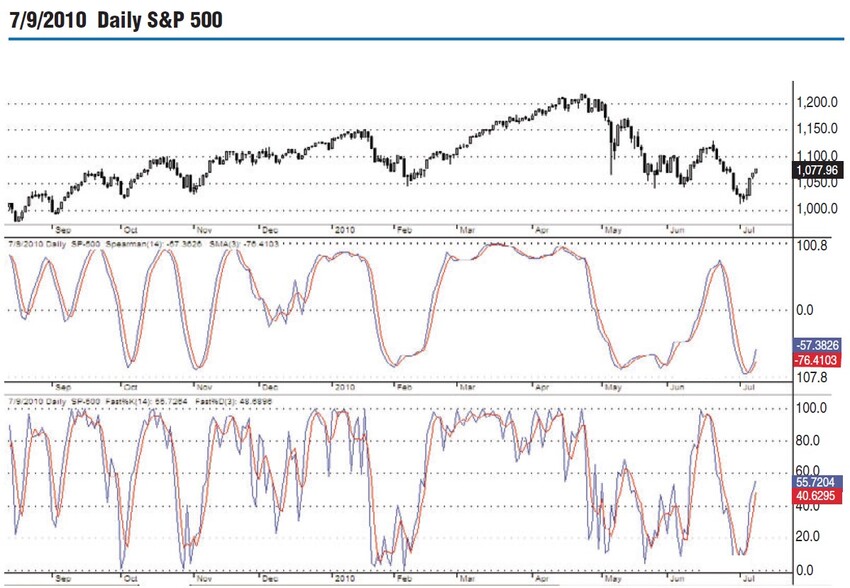
On the daily chart we see a far noisier fast stochastic %K than the Spearman indicator. Even the averages calculated for the two are inclined to favor the indicator. This comparison between the Spearman and fast stochastic may open a door to further research, but currently, it is only meant to bring together two distant relatives of the same family that serve the same purpose: better detection of trends and turning points.
TO CONCLUDE
The Spearman rank correlation coefficient is an old statistical measure used to determine the correlation between ranks of two data series of equal size. Usually during an uptrend we expect higher close prices, while during downtrends the reverse is true. Therefore, the use of the Spearman indicator is suitable to measure the correlation between ranks of historical prices and ranks of the same prices within consecutive groups of N elements, where N is the period chosen.
The Spearman indicator is an oscillator ranging from -100 to +100. It is a straight-forward measure of trend strength based on ranking the closing prices. Turning points in prices occur when trends get weaker and the indicator crosses above and below its short moving average. Major reversals are identified more accurately on monthly charts when the indicator and its short moving average cross each other in the extreme areas above +80 (top) and below -80 (low).
The zero level works well as a filter for long and short entries into the market, and, as with any oscillator, the indicator helps traders and investors by showing divergences with the price. The Spearman indicator adds to the existing portfolio of tools and strategies, but it is not a mechanical indicator. You should employ solid money and risk management rules to avoid situations when indicators could fail.
Dan Valcu is a private trader, a Certified Financial Technician (CFTe), and on the International Federation of Technical Analysts (IFTA) board of directors. His website, www.educofin.com, focuses on trends and trading using heikin-ashi and trend-based proprietary systems.