Trading Articles
Slow Relative Strength Index for Trend and Momentum Analysis
J. Welles Wilder’s classic relative strength index has enjoyed a large following of technical analysts over the years. Here’s a slow version of it. The slow relative strength index (SRSI) is a momentum price oscillator that measures change in price movements relative to an exponential moving average (EMA). Like the relative strength index, it oscillates between zero and 100. SRSI is considered overbought when above 80 and oversold when below 20. SRSI can also generate signals by looking for divergences and centerline crossovers. Sounds similar to RSI, doesn’t it? It is, and in fact, I use Wilder’s RSI formula to calculate the SRSI.
Calculating SRSI
The SRSI is calculated using the following formula:
SRSI = 100 – [100/(1+SRS)] SRS = Average positive difference/Average negative difference
- The SRSI measures the strength of a security relative to a six-day EMA
- The closing price is used for this EMA. The difference is positive when the close is above the six-day EMA
- Positive difference = [Close –Moving average]
- Difference is negative when the close is below the six-day EMA
- Negative difference= [Moving average – Close]
- Negative difference values are expressed as positive values, not negative values
- If the closing price equals the six-day EMA, then difference = 0 (no change).
Smooth positive and negative difference values are based on Wilder’s smoothing technique, which was suggested by Wilder in his book New Concepts In Technical Trading Systems.
The first positive/negative difference values are simple 14-day averages. Subsequent positive/negative difference values are smoothed by multiplying the previous 14-day positive/negative difference values by 13, adding the most recent positive/negative difference values, and dividing the sum by 14.
If average negative difference equals zero, a “divide by zero” situation occurs for the SRS. In such a situation, SRSI is set to 100, which means closing prices moved above the six-day EMA during all 14 periods. In other words, there were no negative differences to measure. The SRSI is zero when average positive difference equals zero, which means closing prices moved below the six-day EMA during all 14 periods. In other words, there were no positive differences to measure.
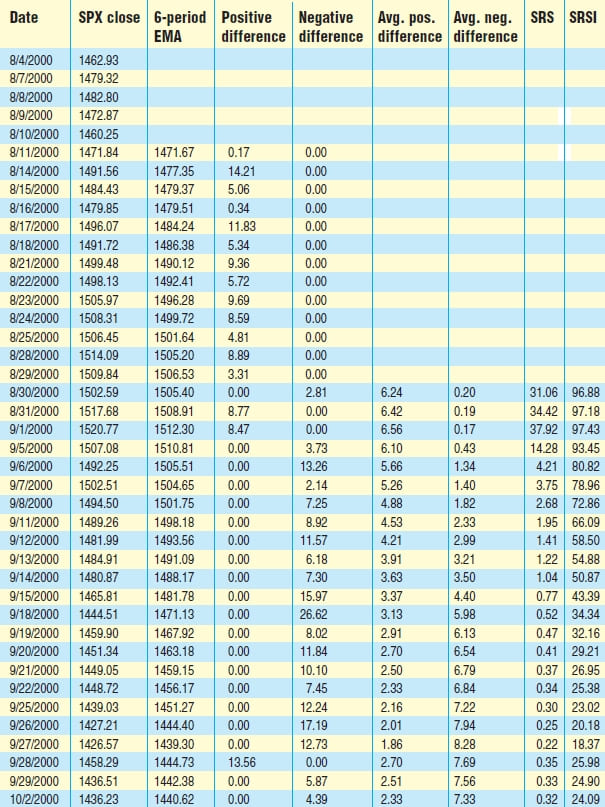
The table in Figure 1 shows an example of the calculation of SRSI in an Excel spreadsheet. The values of six and 14 are the default settings used with the SRSI, but other values can be substituted depending on your trading style and goals. SRSI is considered overbought when it is above 80 and oversold when below 20. These levels can also be adjusted to better fit the security.
Comparing It To RSI
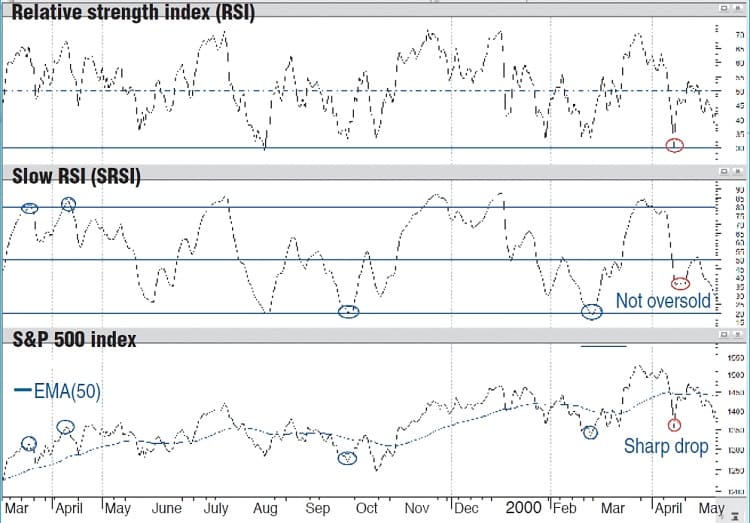
The daily chart in Figure 2 shows the S&P 500 large-cap index (SPX) with RSI (14) and SRSI (6,14) from March 1999–May 2000. The long-term momentum signals given by SRSI are stronger than those of the RSI. As a result, the SRSI generated additional overbought/oversold signals (blue ellipses). It can give more buying/selling opportunities. When it comes to short-term signals, the SRSI ones are weaker than those of the RSI (red ellipses). SRSI generates centerline crossovers and overbought/oversold signals a little later then RSI signals. This is because SRSI measures change of price movements relative to a six-day EMA.
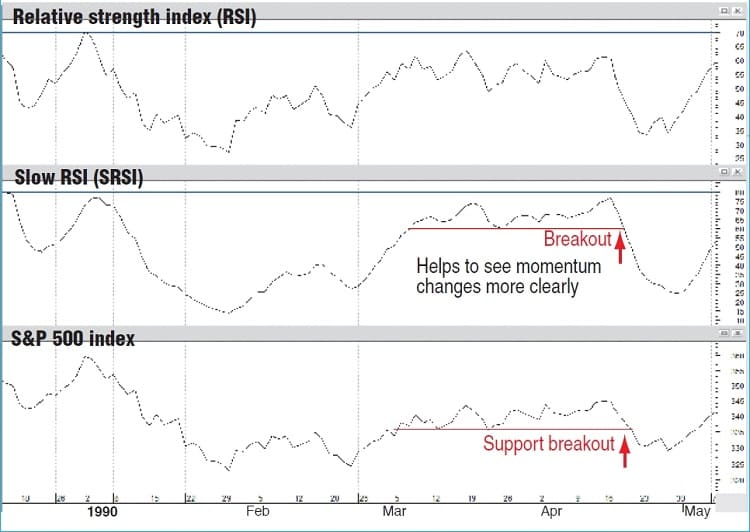
In Figure 3 you see another example of a chart of the SPX with RSI (14) and SRSI (6,14) from December 1989–May 1990. The SRSI break below support confirmed the SPX break of its support level in April 1990. The SRSI helps you see momentum changes more clearly than the RSI does.
Comparing It To The MACD
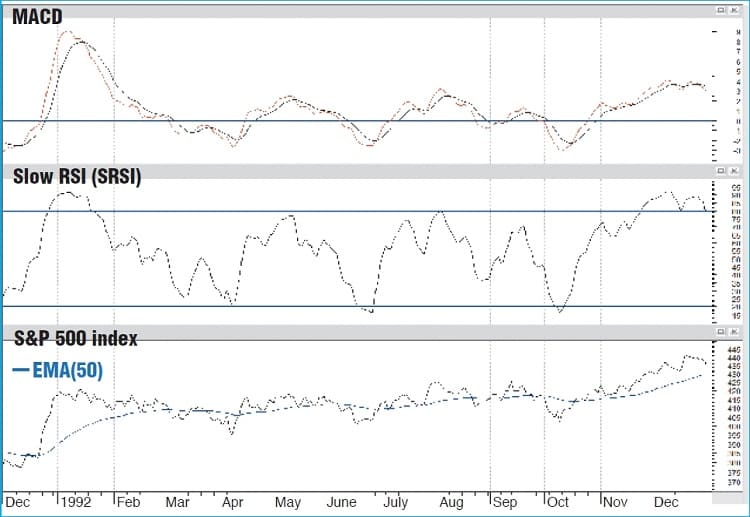
The daily chart in Figure 4 shows the SPX with moving average convergence/divergence or MACD (12,26,9) and SRSI (6,14) from December 1991–December 1992. Since the SRSI has upper and lower limits, it is useful for identifying overbought (80) and oversold (20) levels. MACD doesn’t have these up/down limits.
Applying SRSI
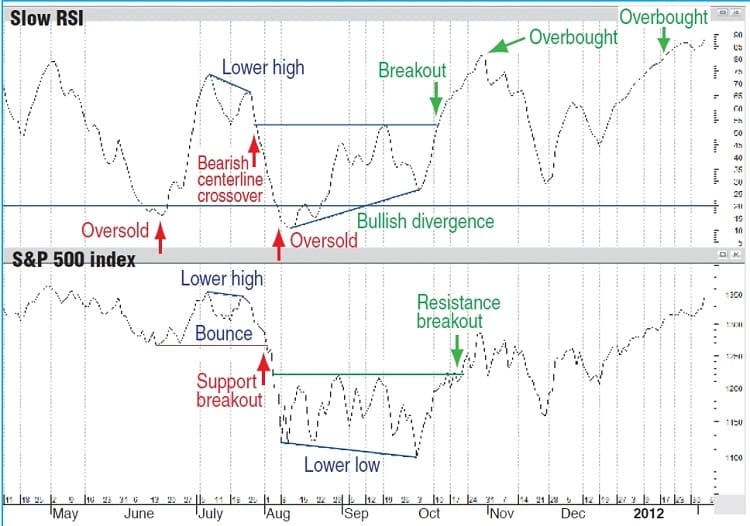
The chart in Figure 5 shows the SPX with SRSI (6,14) during the volatile 2011 market. The SPX fell in early June and SRSI was oversold at that time. The SPX then bounced (June–July) and made a lower high, which was confirmed by SRSI. Bearish centerline crossover and SPX support break occurred in late July/early August.
Advanced Books and Courses on Technical Analysis


The SRSI oscillator was oversold in early August and SPX bottomed in early October. The SPX recorded a lower low, but SRSI formed a higher low. It formed a bullish divergence, which was confirmed by momentum breakout and SPX resistance breakout in October. In late October, the oscillator reached overbought territory. The SRSI overbought and oversold readings work when prices move sideways within a range.
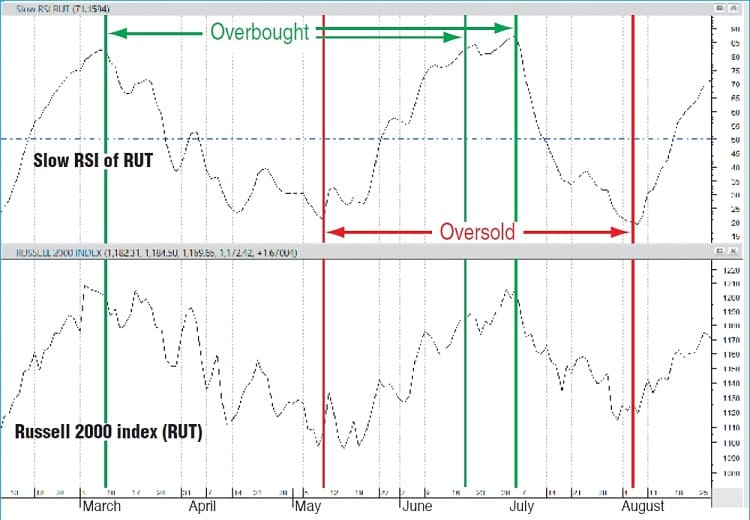
In the chart of the Russell 2000 small-cap index (RUT) in Figure 6 you see the index moving between 1,096 and 1,209 from February–August 2014. The stock peaked when SRSI reached 80 and bottomed when SRSI reached 20. In Figure 7 you see the weekly chart of the SPX with SRSI (6,14) from June 2001–October 2008. SRSI bullish momentum breakout in early May 2003 was confirmed by SPX resistance breakout in late May. SRSI surged above 80 in late 2003 and then moved into its bull market range (34–95) with the 34–50 zone acting as support. These ranges may vary depending on SRSI parameters, strength of trend, and volatility of the underlying security.
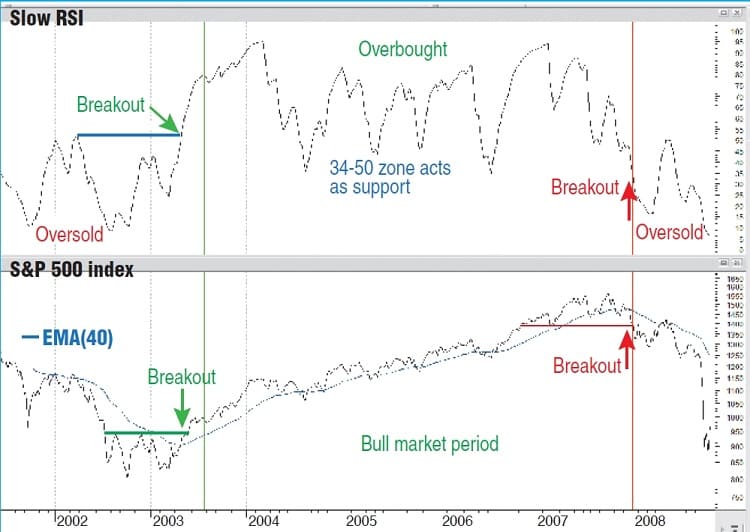
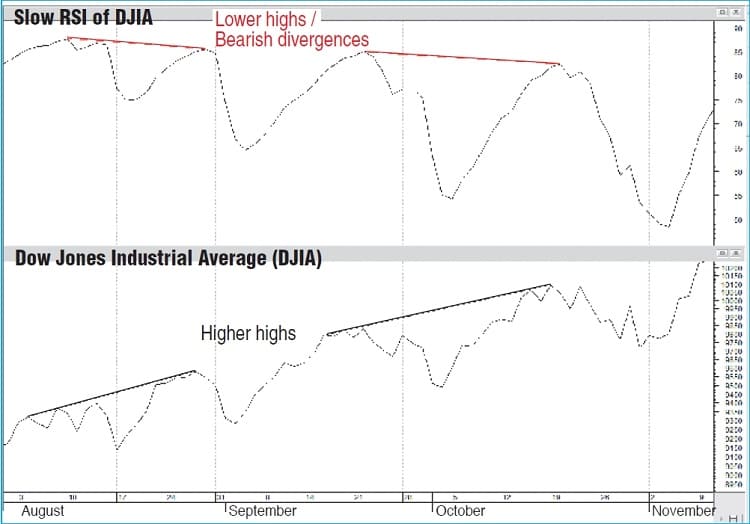
In January 2008, SPX broke below support, which was confirmed by the break below the momentum support zone (34–50) of the oscillator. SRSI moved below 20 in late February 2008 to signal the start of a bear trend. A strong uptrend can show numerous bearish divergences, which may warn of a short-term pullback, but it doesn’t mean there’s a major trend reversal. The chart in Figure 8 shows the Dow Jones Industrial Average (DJIA) from July–November 2009 with two bearish divergences and a continuing uptrend.
The weekly chart in Figure 9 shows the SPX with SRSI (6,14) from October 2006–December 2009. SPX made higher highs, but SRSI formed lower highs from February–October 2007. This bearish divergence was confirmed when the SPX broke below support and the SRSI broke below its momentum zone support (34–50) in early January 2008.
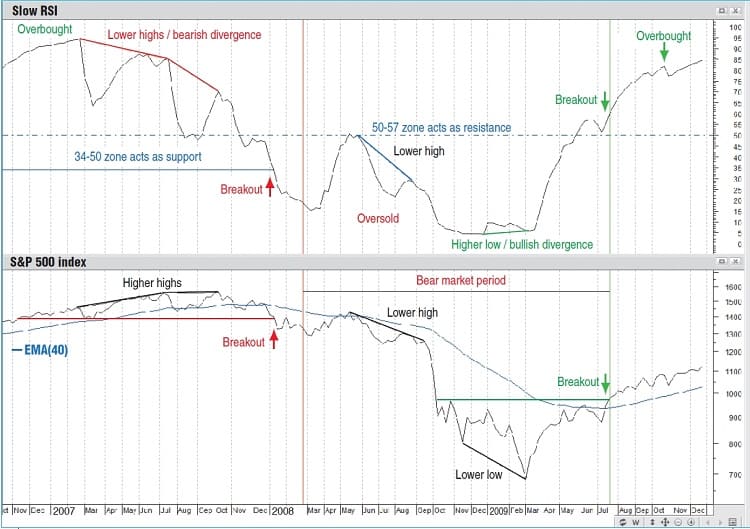
The oscillator was oversold at the end of February 2008 and signaled the start of a bear range (4–57) with the 50–57 zone acting as resistance. After a bounce (March–May 2008), the SPX made a lower high, which was confirmed by SRSI. The SRSI moved below 20 in early October 2008 and the SPX bottomed in early March 2009. SPX recorded a lower low, but SRSI formed a higher low. It formed a bullish divergence, which was confirmed by a breakout above the momentum zone (50–57) and breakout of the SPX above its resistance level in late July 2009. The oscillator became overbought in mid-October 2009.
The SRSI helps you see momentum changes clearly and identify trend continuations or reversals.
It’s Diverse
The SRSI can be used to identify price direction; momentum; price and indicator divergences; and trend direction. It’s a diverse indicator similar to the RSI but has subtle differences. Its bullish/bearish divergences can generate good buy & sell signals, but they are not as effective during strong trends. The SRSI can be used in conjunction with other indicators and price analysis as a confirming tool.
- Apirine is a programmer engineer with an interest in technical analysis, especially the application of relative strength index to trading.