Trading Articles
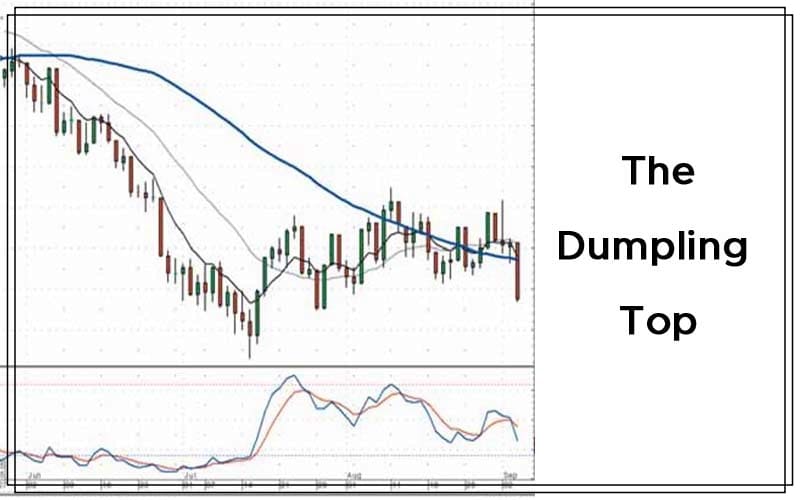
The Dumpling Top By Stephen W. Bigalow
This candlestick pattern projects the selloff. Candlestick signals are considered highly accurate because their graphic formations are produced by changes in investor sentiment. The information built into each individual signal becomes an even more powerful analytical tool when they are utilized for identifying candlestick patterns. The signals and patterns work just as effectively for identifying bullish price moves as well as bearish ones. Candlestick signals also interpret what is occurring in investor sentiment. This combined information creates extensive insights into price movements. Not only that, these signals produce highly accurate trend reversal identifications. Each signal incorporates an immense amount of information.
WHY RECOGNIZE PATTERNS?
Common sense dictates that when the markets are moving up, most stocks will be moving up. The same is true in bearish market conditions; most stock prices are going to decline. Candlestick patterns produce a great advantage for investors in that they yield expected results. Candlestick signals and patterns allow investors to get a clearer evaluation of what is occurring in investor sentiment. Human emotions exhibit recurring thought processes, which leads to recurring price patterns. Candlestick analysis is merely the visual recognition of what is happening in investor sentiment. This leads to greater accuracy for projecting which direction price trends may be moving.
THE DUMPLING TOP
This greater accuracy in trend projection was evident in the development of the dumpling top that formed in the Dow Jones Industrial Average (DJIA) over the summer (Figure 1). The dumpling top can be recognized by its slow-rounding top; the trajectory of a bullish trend is gradual and indecisive. The indecisiveness can be recognized by the appearance of dojis, spinning tops, small hammer signals, and small haramis, making for an easy trend assessment. These signals reveal the bulls are not convinced of the uptrend.
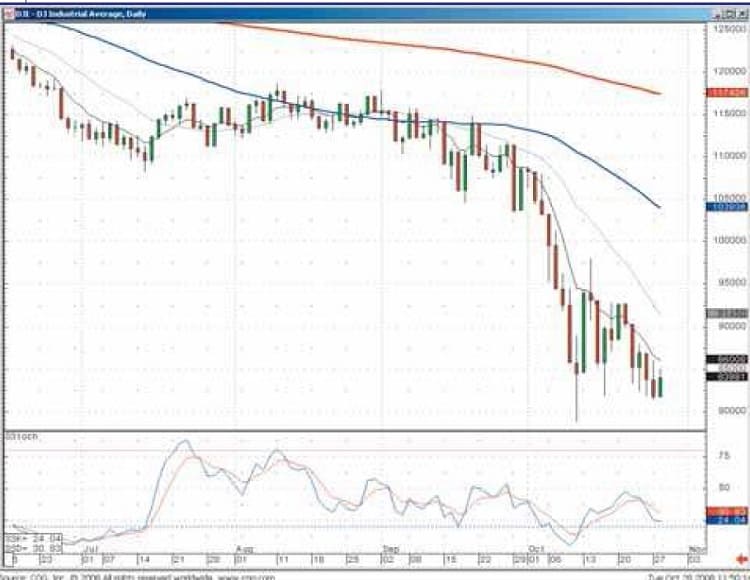
After a while, the bullish investor sentiment wanes, making for a relatively flat trading period, followed by a slowing negative investor sentiment. The big advantage that candlestick patterns provide are expected results. At the end of the pattern, the bulls are not participating and the bears start moving the trend with confidence. The dumpling top formation results in a severe selloff.
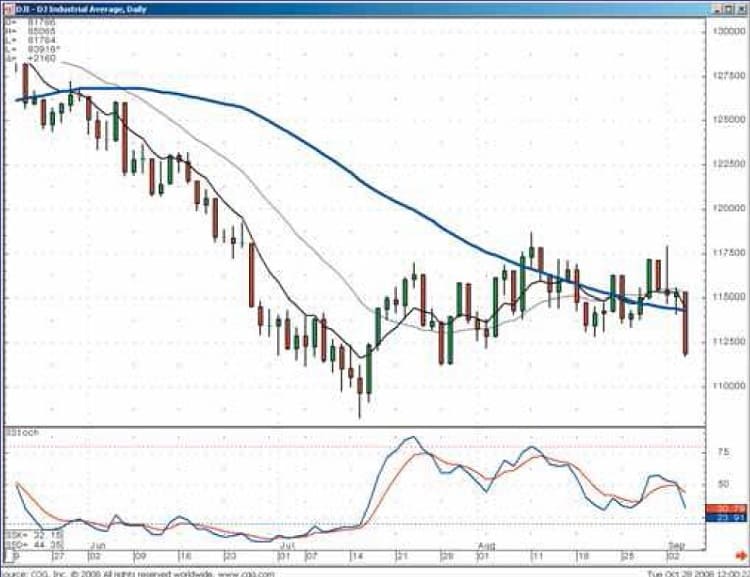
Knowing what constitutes a dumpling top formation allows investors to formulate the best trading strategies for the market conditions (Figure 2). Once it becomes evident that a dumpling top is in progress, two valuable pieces of information become evident. First, until the pattern is completed, price movements are going to be relatively indecisive. This allows investors to make decisions that are most appropriate for the current market conditions.
For the short-term or active trader, the trading is going to be in and out of positions extremely fast, basically scalping. For those investors who cannot sit by the screen and trade actively, they will have decided not to invest at all until the pattern is finished. The risk/reward factor is not worth exposing funds to the market.
Suggested Books and Courses About Candlestick Patterns
The other valuable piece of information is being aware of what you can expect at the end of the dumpling top pattern, a hard selloff. Once the price action starts to indicate the sellers are aggressively taking control, a high-probability trading strategy could be put into action. The candlestick investor will be sitting in cash during the slow trading environment over the summer. Being in a cash position when the dumpling top starts to produce the expected results give you the opportunity to commit to shorting positions or buying short funds.
DOW SUMMER OF 2008
Candlestick analysis utilizes approximately six high-profit patterns. They provide a graphic look into price actions created by the buildup of investor sentiment. The analytical value of these patterns is found in the evaluation of market trends as well as individual stock prices, creating a strong trading platform. Candlestick analysis provides clarity when analyzing the market trend. With that knowledge, positioning a portfolio in the direction of the trend can be done so with greater confidence. If the markets are deemed to be bullish, logic dictates that most stocks will move up. Being able to visually analyze candlestick patterns improves the probabilities of being in the right position at the right time.
Profits can be greatly improved by participating in stocks that are creating price pattern setups. The expected result from a pattern is a much stronger price move than normal price patterns. In addition, losses can be greatly reduced when quickly identifying that a price pattern is not performing at obvious technical points. Essentially, the simple rules applied to candlestick signals and patterns produce an effective trading program for identifying a potentially strong price move and a simple stop-loss program.
There is comfort in being on the right side of the market at the right time. There is also comfort in identifying when to be out of the market. Knowing what price movements should occur after specific signals and patterns improves investor perceptions. It takes the emotions out of investment decisions and also puts investor funds in situations with a greater probability of performing as expected, and the results usually involve greater profit moves than a normal market movement. Candlestick analysis is not rocket science. It is merely the common-sense graphic depiction of investor sentiment. Most investment programs want you to learn “hidden secrets” that will make you wealthy; candlestick analysis has no such secrets. Each signal and pattern can be explained with easy-to-understand logic of why that signal/pattern developed.
Whether you are investing based upon fundamental research or technical indicators, overlaying candlestick analysis into your fundamental research for your existing technical trading program will enhance your investment capabilities. Candlestick signals reveal what is going on in investor sentiment in the immediate moment. Candlestick signals incorporated into pattern development allow investors to project what the next price movements should be. Take advantage of the knowledge built into candlestick analysis tools. Once learned, the simple visual graphics will enhance your investment perceptions for the rest of your life.
Stephen W. Bigalow is author of Profitable Candlestick Investing, Pinpointing Market Turns to Maximize Profits, and High Profit Candlestick Patterns. He is also principal of www.candlestickforum.com, providing information and educational material about Japanese candlestick investing. Bigalow has developed multiple trading programs, utilized in his candlestick trading hedge fund, for the daytrader to the long-term hold investor.