Trading Articles
The 4% Indicator Revisited By Michael J. Collins

This simple time-tested indicator allows investors to trade with the trend to achieve above-average returns. As trend-following traders, we understand that success depends on identifying and trading with the price trend of the markets. We have come to appreciate the saying that “the trend is your friend.” More than 20 years ago, Martin Zweig, in his book Winning On Wall Street, featured a simple indicator designed to help an investor follow the price trend of the markets. Zweig called this the 4% indicator. In his book he illustrated that for the 22-year period ended late 1988, if an investor followed this indicator, a modest $10,000 investment would have grown to more than $233,000! This is an approximate 15% compounded annual rate of return — a remarkable return that significantly exceeded market returns.
But that was then. Due to changing market dynamics, many indicators appear to work for a certain time and as conditions change, the indicator loses its effectiveness despite what backtesting results have shown. This article revisits the 4% model and explores its effectiveness in current market conditions. Is this indicator still relevant 20 years later? To find out, I developed a trading model.
THE 4% INDICATOR
Often, the simpler the indicator, the easier the model is to execute. It doesn’t get much simpler! As Zweig shows in his book, the 4% indicator uses the Value Line Composite Index to generate the buy and sell signals. The Value Line Composite is a collection of 1,700 companies that are equally weighted and covered in the Value Line Investment Survey, a popular investment service. This index consists primarily of mid-cap stocks and is therefore more representative of underlying market movements. Fortunately, you only need to be concerned with the weekly close of this index:
A buy signal occurs only when the weekly close is at least 4% higher than the previous week’s close. A sell signal occurs only when the weekly close is at least 4% lower than the previous week’s close.
You only need to look at the Value Line index once a week and perform the necessary calculation to determine if any action needs to be taken. For example, assume the weekly close of the index is 316.69. To initiate a trade, the index must close the following week 12.67 points higher (buy) or lower (sell). This is 4% higher or lower than the previous weekly close. If this does not happen, you do nothing. In this case, let’s assume the Value Line closes the following week at 330. Since 330 is 4% higher than the prior week’s close of 316.69, you will initiate a buy. You would hold this position until the index closes 4% or lower than the previous week. Continuing with the example, assume the market rallies and four weeks later the index is now at 355. The next week, the index closes at 337. Since 337 is 4% less than the previous week’s close of 355, you exit your position. The result is a gain of approximately 6%. Now let’s develop the model.
THE TRADING MODEL
This long/short model is mechanical in nature. All buy/sell decisions are clearly defined and based on price using the 4% indicator. The model will use the Value Line index to generate the buy and sell signals. The exchange traded fund (ETF) used for trading purposes will be the Russell 2000 i-Share (IWM). IWM is extremely liquid, trading more than 50 million shares daily.
Go long IWM on the buy signal and hold the position until a sell signal occurs. You then close the long position and initiate a new short position at the opening the next trading day. Again, the position is held until the next buy signal, at which time the position is closed and a new long position is established. The investor is either long or short the IWM. Remember, the buy/sell decisions are made using the Value Line index and the trades are executed using IWM. The model results in this summary have been backtested from 2001; that is the first full year that i-Shares traded on the Russell 2000. For the purposes of this article, we will refer to the model as the TT.
PERFORMANCE SUMMARY
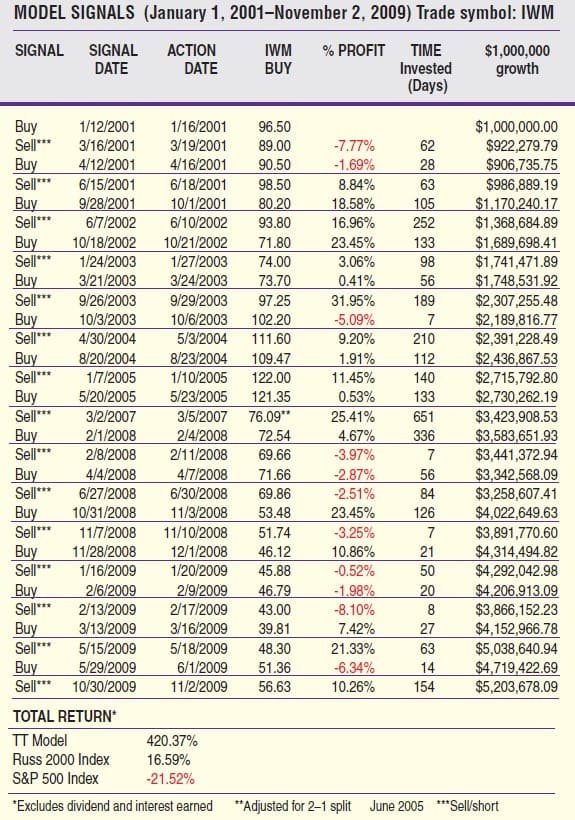
As Figure 1 illustrates, utilizing the TT model produced interesting results. A hypothetical $1 million has grown to more than $5 million in approximately nine years, producing a total return of more than 400%. This equals an approximate 20% compounded annual rate of return and compares favorably to the returns that Zweig produced in his study more than 20 years ago.
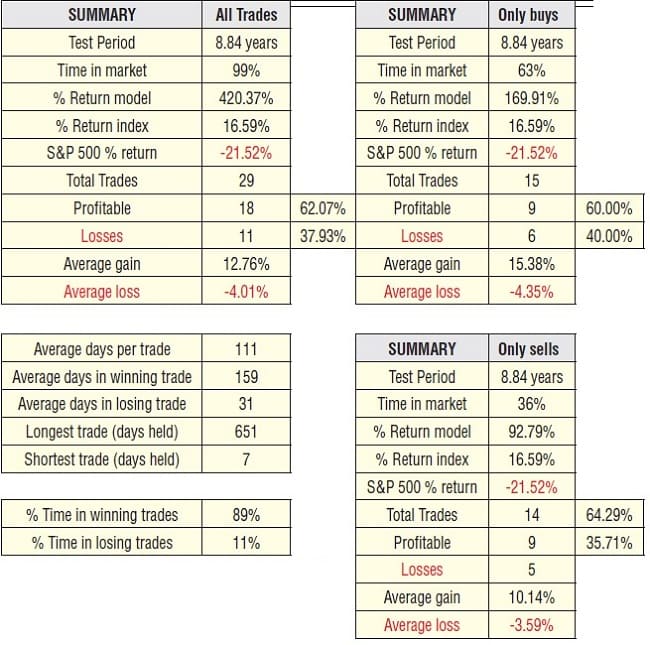
Figure 2 summarizes the results produced by the model under three different conditions. This allows you to see returns across different risk parameters:
- Scenario 1 (all trades): Use all the signals.
- Scenario 2 (long only): Only go long on the buy signals and exit on the sell signals. Go to cash until the next buy signal.
- Scenario 3 (short only): Only sell short on the model sell signals and close position on the buy signals. The rest of the time, remain in cash until the next sell signal.
Suggested Books and Courses About Market Indicators

Several points are worth noting:
- In all three scenarios, the TT model performance results significantly exceed the buy & hold index returns.
- The win/loss ratio is consistent across all scenarios, but the winning trades are almost three times as large as the losing trades. Interestingly, Zweig produced similar results using this indicator more than 20 years ago.
- Finally, the model seems to hold winners and cut losses quickly. On average, a losing trade was held only 31 days, while winning trades were held more than four times longer (159 days).
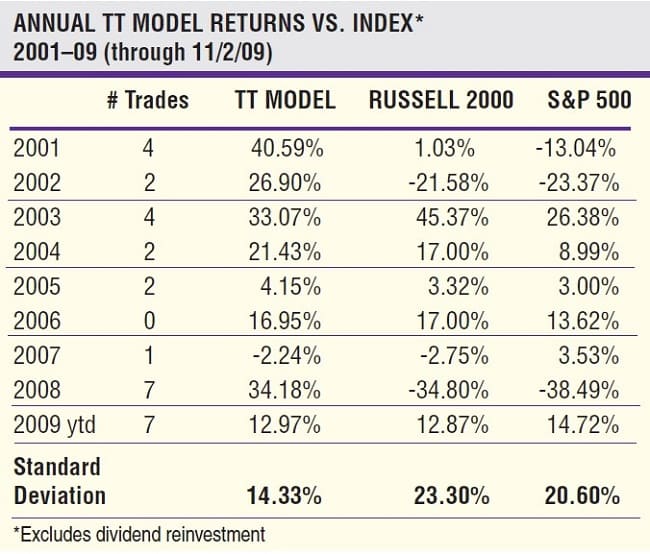
Figure 3 shows the annual returns of the TT model vs. the Russell 2000 and Standard & Poor’s 500 indexes. To summarize:
- The model produced 29 trading signals over the past eight-plus years.
- The TT model produced positive returns in every year but one (2007). The model underperformed the S&P 500 in just two of the last nine years.
- The worst year for the model was 2007. Investors experienced a -2.24% return.
- The timing model significantly outperformed in flat to down markets. This was especially true in 2001, 2002, and 2008.
- Finally, it appears investors experienced less risk (as measured by standard deviation) by using the TT model vs. buying and holding the indexes. In short, this model produced almost 20 times the return of the respective benchmarks while incurring lower risk.
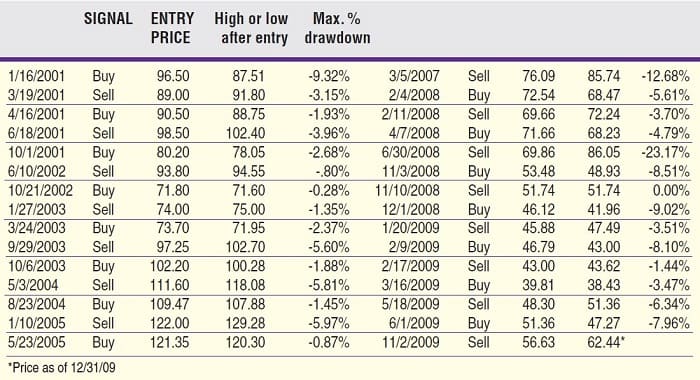
To further measure risk and volatility, Figure 4 shows the maximum percentage (%) unrealized loss an investor would have been exposed to between signals (otherwise known as drawdowns). To summarize:
- For the 29 trading signals, the average percentage drawdown between signals was -5.02%.
- The median percentage drawdown between signals was -3.61%.
- The largest drawdown between signals was -23.17%, occurring in 2008.
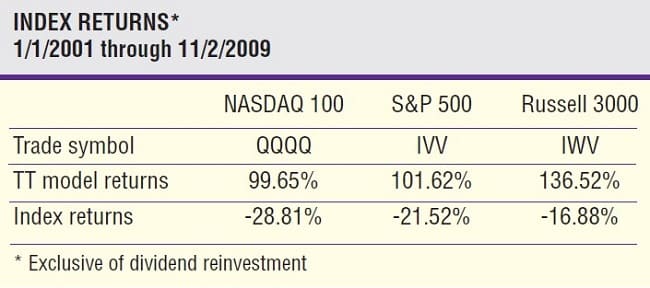
Finally, the model signals seem to have validity when applied to other ETFs. Figure 5 shows performance returns when the model signals are applied to three other indexes: the NASDAQ 100, the S&P 500, and the Russell 3000. Without exception, the model returns significantly outperformed the respective index returns.
CONCLUSION
The TT model signals are mechanical and based on price. The strategy is clearly designed to keep the investor in tune with the price trend of the market. All entry and exit signals are executed according to the 4% model indicator, without regard to personal biases. The results show that the model has been successful in this pursuit. Given the results, the simple 4% indicator has stood the test of time, exhibiting a superior 40-year track record. Of course, past performance is not a guarantee of future results. At the least, the 4% indicator appears to be a helpful tool to identify and trade with the trend.
Michael Collins has been in the securities industry for more than 28 years. He currently is a senior vice president of investments and senior portfolio manager in the PMP program at UBS Financial Services.