Trading Articles
Surfing Your Position With Wave Stops By Eugene Labunsky
When is a good time and place to exit a position? Whether inspired by Ralph Nelson Elliott’s works or by just a casual observation of a price chart, you can’t help but notice how prices advance, then pause and correct in a wavelike action. What if you could take that basic price movement on the part of buyers and sellers, supply and demand, and use it to manage your position? That is the basic objective of wave stops, the method I developed to determine a good time and place to exit a position.
Wave Stops
Wave stops are unusual because the concept does not rely on price or volatility directly. It is a method to set a stop and exit a position based on the profit draw-down of the position. Price and volatility are taken into account, but in an indirect manner. We assume that most moves will come in a three-wave movement — that is, a strong move up, followed by a price correction, followed by the next move up, and so forth. It is not necessary to have three waves; more or less is fine. This process also works with down movements.
Let’s look at the wave stop rules on a price movement (Figure 1). For this case, let’s use a simple long position. Take a position and set an initial profit target. Once the price gets to or above the initial profit target, apply wave stop rules. The rule states that you must monitor the position’s profit. If it corrects more than a fixed value (x%), that signals that a correction is in process. This is wave 1. Continue to monitor the profit drawdown until a second point is hit (y%). This is your exit or sell-stop level.
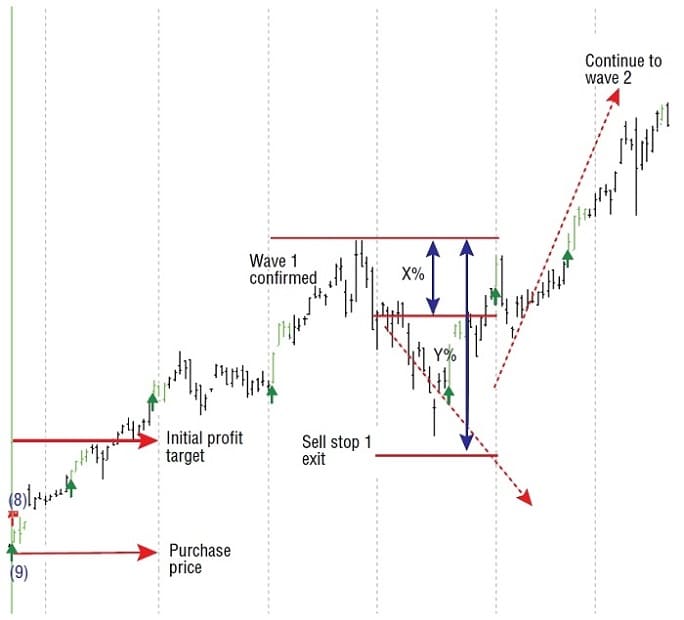
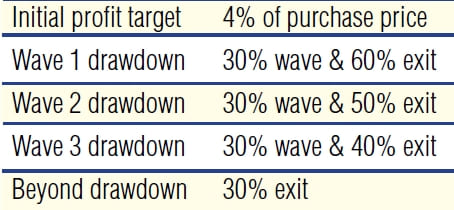
If the profit drawdown never reaches the exit point of y%, continue by applying the second set of wave-stop parameters. If the x% level is never reached, remain in the first wave. Each wave can have a different set of parameters. My suggested initial settings can be seen in Figure 2. Continue to follow the profit of the position, and the price, until you are eventually stopped out of the position.
Applying Wave Stops
Let’s look at an example of wave stops in action to clarify the concept (Figure 3). Say you assume a long position, buying a stock at $100. Your initial profit target (where wave stop rules start) is 4%. Thus, once the price of the stock hits $104 per share, start monitoring the position with wave stop rules. Let’s assume a rule set of 30–60% for wave 1, 30–50% for wave 2, 30–40% for wave 3, and 30% for all those beyond wave 3.
Monitor the position once the price is at or above $104 until you have a 30% profit drawdown. This will signify the beginning of wave 1. Let’s assume the price rises to $110, at which point your profit becomes $10. If the profit drops by 30% to $107, you watch it closely. If it drops 60% to $104, then you sell. As long as the profit drawdown does not exceed the second parameter (60%), you will remain in the position. If it drops below 60%, sell and exit your position.
Suggested Books and Courses About Elliott Waves Method
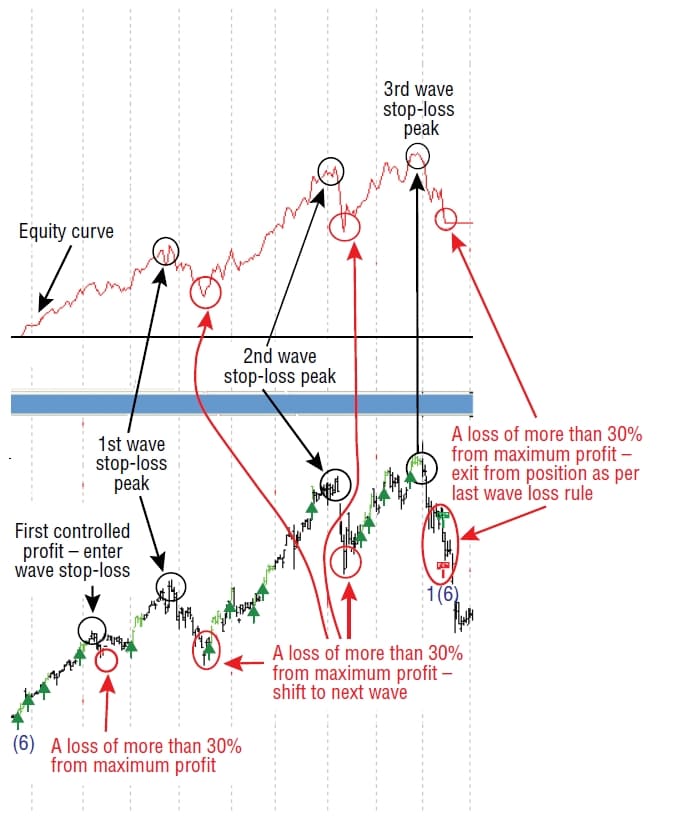
As price enters wave 2 of its climb, use the second set of wave stop parameters (30–50%). Again wait for a drawdown from the profit’s high-water mark by 30% to indicate the second price correction. In this example, you will exit the position if you have a 50% or greater drawdown. If not, you continue. As price enters wave 3 of the movement, use the third set of wave stop parameters (30–40%), each one tighter as the price increases. The same rules apply here: You use 30% as the signal for wave 3, and 40% as the profit drawdown amount to sell and exit. If price continues beyond a third wave, you would use the last parameter (30%) as a trailing-profit loss.
It is important to note I am not talking about a 30% drop in price but a 30% drop in profit, from the highest measured point (that is, the high-water mark). Since the stop level is dynamic, it must be monitored every day, either manually, by a formula set or software designed to monitor it. In fact, I added wave stops as an exit option to my software.
Different Wave Stops for Different Markets
The settings for the wave stop rule will vary from security type to security type. More gently trending markets like foreign exchange and bonds would have different parameters than a large-cap stock, while a small-cap tech stock may in turn have an entirely different setting still. Like any other stop rule, you will need to adjust settings to fit the market. I hope this article has given you some insight into a different way of monitoring your position, setting your stop, and harvesting your profits.
Eugene Labunsky is a financial software writer and developer based in Vladivostok, Russia. He has written custom programs for money managers throughout the world.