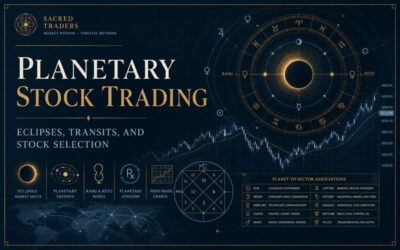
Planetary Stock Trading: Eclipses, Transits, and Stock Selection
The most important factor in determining a shift in the stock market is a solar[...]
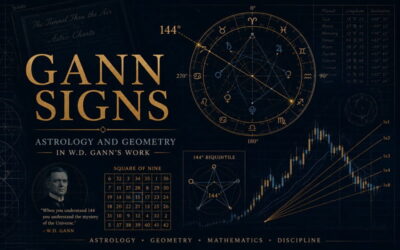
Gann Signs: Astrology and Geometry in W.D. Gann’s Work
Many of you have spent countless hours pouring over Gann’s notes, with little result. This[...]
2 Comments
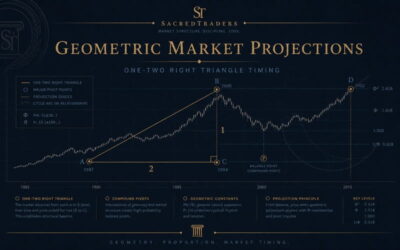
Geometric Market Projections Using the One-Two Right Triangle
A simple right triangle may be used as a template for illustrating important market moves.[...]
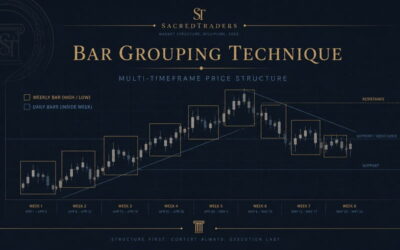
Bar Grouping Technique for Multi-Timeframe Price Analysis
Short-term trends may be seen on an hourly or daily chart. Intermediate trends may manifest[...]
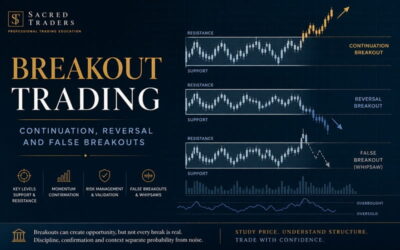
Breakout Trading: Continuation, Reversal and False Breakouts
Who hasn’t harboured the thought of reaping massive profits from a big price move in[...]
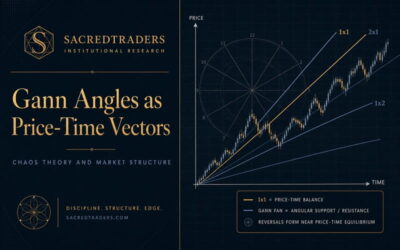
Gann Angles as Price-Time Vectors: Chaos Theory and Market Structure
A butterfly, flapping its wings in New York, moves an infinitesimal mass of air, and[...]
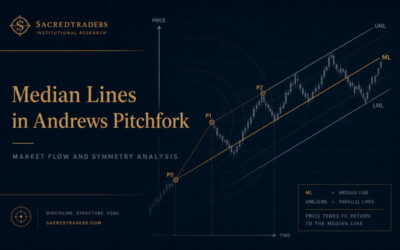
Median Lines in Andrews Pitchfork: Market Flow and Symmetry Analysis
The median line (ML) is the line that joins the anchor (P0) with the middle[...]
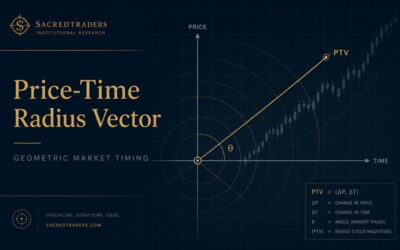
Price-Time Radius Vector (PTV): Geometric Market Timing Method
A variety of techniques attempt to forecast prices in financial markets. However, relatively few deal[...]
Presidential Cycle Seasonality: A Market Timing Study
Mark Vakkur made another significant research contribution by publishing another seminal article in the October[...]

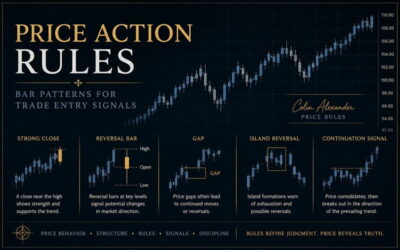
Price Action Rules: Bar Patterns for Trade Entry Signals
This article describes price patterns, or price rules, that call for action when other indicators[...]
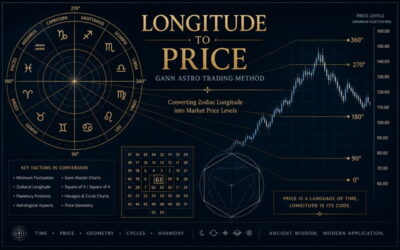
Converting Longitude to Price: Gann Astro Trading Method
The secret to converting zodiacal longitude into price levels is always based upon the minimum[...]
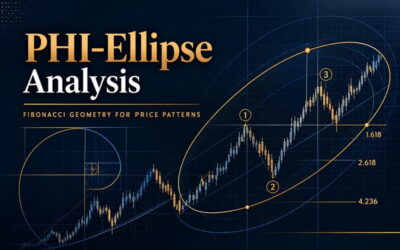
PHI-Ellipse Analysis: Fibonacci Geometry for Price Patterns
The PHI-ellipse is a unique Fibonacci trading tool that can only be drawn by a[...]
3 Comments