Trading Articles
Gann Angles as Price-Time Vectors: Chaos Theory and Market Structure
A butterfly, flapping its wings in New York, moves an infinitesimal mass of air, and this, through a series of chain reactions, leads to a hurricane in Miami causing serious damage. Obviously this is a paradoxical situation, but it is a form of reasoning that uses the latest metamodels derived from contemporary physics and, more precisely, it is the reasoning at the base of chaos theory. One aspect of chaos theory studies series and chains of phenomena that lack a cause-effect relationship.
Chaos Theory
The aim of chaos theory is to develop models able to create functions that can mathematically describe and represent the statistical data derived from phenomena apparently heterogeneous and casual. Ok, let’s get back to the butterfly. Have you ever seen a butterfly flap its wings in New York and then cause a hurricane in Miami? If you really answer yes, then only you in all the world has been able to witness this!
And yet you have probably heard of avalanches falling from mountains into valleys and causing serious destruction. In the case of the avalanche, what do you think has happened? Actually, something similar to a butterfly’s flapping wings causing a hurricane in Miami. Very often an avalanche begins with a bit of snow at the top of a mountain. As the snow slides down it picks up velocity and encompasses larger and larger quantities of snow until it becomes an avalanche of gigantic size. If you knew that the snowball was destined to transform itself into an avalanche, you would evacuate the targeted area in time.
Why can’t you know this ahead of time? It’s because, despite the fact these phenomena have a temporal continuity, you see only the final event, the avalanche. There is a temporal continuum that links together events with cause-and-effect structures, which are extremely precise and deterministic. Unfortunately, you do not know the beginning of the story; you don’t know the first ring in the chain of events that ends up as an avalanche.
If we had a helicopter from which we could follow all of the phases from the first shift of a handful of snow to the avalanche, we would see everything from the beginning until the catastrophic final impact. We could film the entire flow of events to see the changes from moment to moment. Instead, chaos theory operates with a series of data, apparently uncorrelated, and aims to provide mathematical models able to predict the final events.
The difference between the famous butterfly example and a snowball transforming into a fatal avalanche is that the air moved by the wings of the butterfly is apparently too small a phenomenon to be observed. Further-more it is invisible and it cannot be filmed, while the event of an avalanche could, in theory, be filmed from beginning to end. Gann was a master ante litteram of chaos theory: He measured the effect of imperceptible movements, like the flapping of the butterfly’s wings, which can have extraordinary influence on the financial markets. Gann Angles enable us to measure events that are spread out in time and space. They help us in determining how price increases mass and momentum, and in which direction.
Through the medium of Gann Angles one goes from a negative infinity to a positive infinity. When time and price come into equilibrium, even after decades, we can see in the markets a major reversal. Let’s check it out and see how it works.
How Gann Angles Originated
The base of Gann Angles is the circular dodeca-partite algorithm (CDPA). Dodeca-partite comes from Latin and means divided into 12 parts. Even though Gann never spoke about CDPA, I consider it the real origin of the trading tools that every trader knows as Gann angles.
Below I explain the main features of Gann Angles. I don’t claim to exhaust all issues and properties connected with Gann Angles. Rather, I introduce the most important concepts to study and use Gann Angles in a quantum way.
CDPA can be basically represented as a circle on which two forces move around in opposite directions. These two forces are price (P) and time (T) (see Figure 7.1).
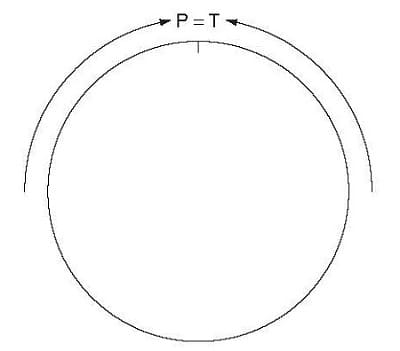
The circle is the geometrical figure that conveys the concept of “whole-ness,” and price moves throughout time. When price and time are in balance with each other we can have a reversal. Gann noticed that a top or a bottom can occur when price squares time. So we can come back to the theory of relativity, but instead of using Einstein’s concept of space-time, we can tap into the price-time concept, which is more useful with respect to our trading goals.
Now, just to give you a rough idea of what we mean, if the price of a stock moves from 113 to 133 in 20 days, we are facing a time-price equilibrium and the two forces on CTDA balance each other out. Gann would say that the stock moved 20 dollars in 20 days and so it’s ready for a reversal. In my opinion, to have a top or a bottom, the equilibrium between time and price is a condition necessary, but not sufficient. I discuss this subject more extensively further on.
We can define Gann Angles as a price-time vector because by drawing them from a significant top or bottom, we can have a clear understanding of how price develops throughout time. When price meets time the market will experience a moment of stasis, and we’ll see a trend reversal in the chart.
As we have already seen in Figure 7.1, two forces (P and T) rotate. If you want to graphically depict where these two forces meet and create equilibrium, in order to spot on your favorite chart where a reversal can occur, we need to proceed as follows.
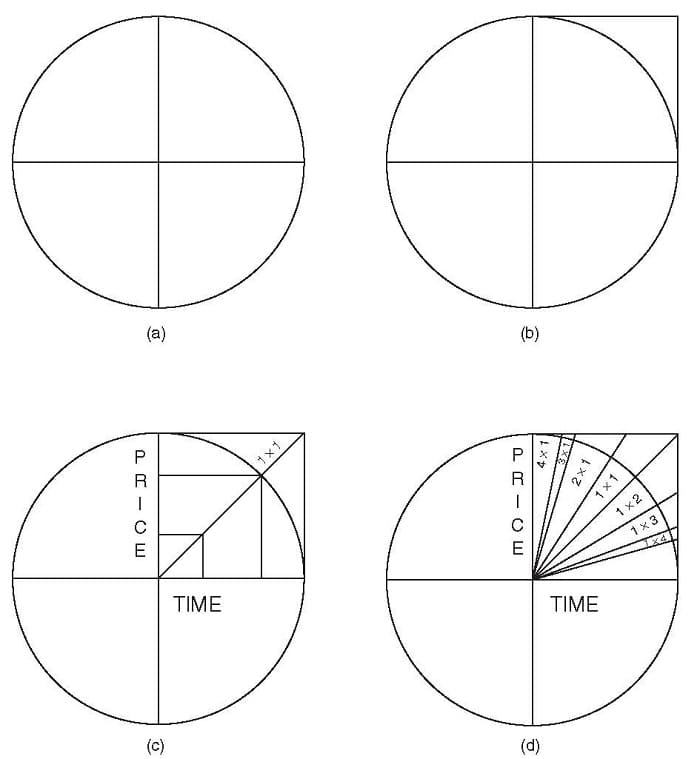
We divide the circle into four quadrants, as we can see in Figure 7.2, and we redraw the upper-right quadrant with two orthogonal line segments. As a result, the quadrant becomes a square, as shown in Figure 7.3. This square is used to draw a Cartesian coordinate system, with time on the x-axis and price on the y-axis. Now we can draw a 45-degree line bisecting the square, as you can see in Figure 7.4.
Every point of the bisecting line identifies, by definition, a point where price and time are in equilibrium, because each point of the bisecting line corresponds to equal segments on both the x-axis and the y-axis. This concept belongs to geometry 101 and is very easy to understand.
Advanced Books and Courses on W.D. Gann Methods
Now let’s draw on either side of the bisecting line, as shown in Figure 7.5, the other segment lines that proportionally divide the square. This fan-shape of lines was called by Gann “my angles,” and therefore is known by traders as Gann Angles.
Examples and Explanations
Gann called the bisecting, 45-degree angle a 1 × 1 angle. This means that in each point placed along the line, the price rises (or falls) one unit of price for one unit of time. The angle immediately above the 1 × 1 angle is called the 2 × 1 angle, and it means that in each point placed along the line, price rises two units of price for one unit of time. The next-higher angle is called the 3 × 1 angle, and at any point along this line, price rises three units of price for one unit of time. The angle immediately above the 3 × 1 angle is called the 4 × 1 angle, and at any point along this line, price rises four units of price for one unit of time.
Gann Angles are also drawn below the initial bisecting line, in the same sequence as the preceding angles. The angle immediately below the 1 × 1 angle is called the 1 × 2 angle, and at any point drawn along this line, price rises one unit of price for any two units of time. The next-lower angle is called 1 × 3 angle, and at any point drawn along this line, price rises one unit of price for any three units of time. The angle immediately below the 1 × 3 angle is called the 1 × 4 angle, and at any point drawn along this line, price rises one unit of price for any four units of time.
As you probably have already noticed, every point of the 1 × 1 angle represents an equilibrium between price and time. It means that, when the price touches the 1 × 1 angle, we have an equilibrium, and therefore we could expect a potential reversal in the chart of the security. Actually, as we mentioned before, this is only a sufficient, but not a necessary, condition, and so to open a new long or short trade we need confirmation from our QPLs, the most important in the hierarchy of the trading tools that we use.
Also, every point along the lines of the other angles show an equilibrium between price and time, although it is not based on a 1:1 ratio anymore, but rather on different ratios such as 1:2, 1:3, 1:4, and so forth, or vice versa. What we have just said in the previous paragraph about a potential reversal that can occur on 1 × 1 angle is true also for all of the other angles. Always consider that we are speaking about a condition that is necessary, but not sufficient.
This means that a Gann Angle can be seen as a resistance or support line with very special characteristics. They are like invisible and immaterial walls that can be perforated by the price, and they become solid only when they’re activated by QPLs. In this case they become very strong levels of support and resistance, as we will see in the next section.
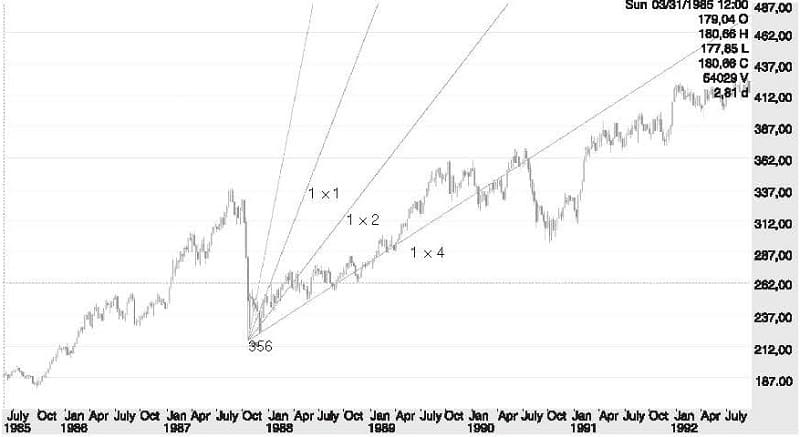
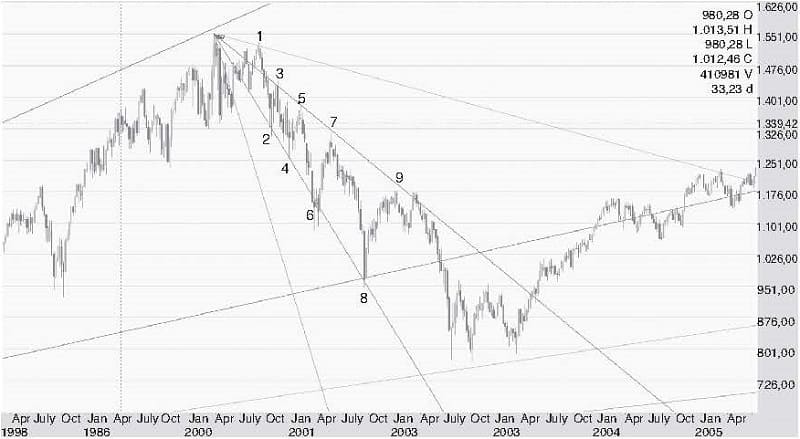
In this example we show ascending angles. We usually draw ascending angles starting from a bottom. The origin of the Gann Angles will overlap with the bottom. In case we want to study the price behavior starting from a top, we have to do the opposite, overlapping the origin of the angle with the top. In this case we’ll draw descending angles. Gann also called angle 1 × 1 a 45-degree angle, and the 2 × 1 angle the 633/4-degree angle, and so on. Notice that these geometrical correspondents are true only when the chart of your stock or currencies is squared, that is, as if you are using graph paper, and the length of a unit of price is equal to the length of a unit of time. In this case the 1 × 1 angle is always the bisector line of a square.
Because we use software that helps us to display Gann Angles on charts that fit a computer screen, unfortunately our charts are almost never a square chart, like the chart that Gann used to draw by hand on graph paper. Furthermore, there is some software that displays 45-degree angles, but these may have a different appearance because they can be distorted by the scale you use on your computer screen. The 45-degree angle (1 × 1) displayed by Gann Angles software doesn’t change if you change the scale of the screen. Another important concept to study is the slope of the 1 × 1 angle, which is very similar to the concept of CS (conversion scale), as Chapter 5 demonstrates for the Price Space Operator (PSO).
If you have a stock ranging from 100 to 200 you can use 1 as the slope for angle 1 × 1. It means that each day the price, according to this angle, rises or falls 1 point, which can be equal to 1 dollar. But if you have a currency that ranges from 1.10 to 1.50, the slope of angle 1 × 1 must drastically change; otherwise it would be useless. In this case you will use as a slope for this angle another value, different from 1. Different authors and traders propose, in this case, several methods to calculate the 1 × 1 angle.
The only method to calculate the slope we use follows a “quantum” scale and stems from the same approach we used for calculating CS value. The number we use as a multiplier can be found in only one of the following sequences:
- 1, 2, 4, 8, 16, 32, and so forth—that is, equal to 2 to the n power 1/2, 1/4, 1/8, 1/16, 1/32, and so forth—that is, equal to 1 divided by 2 to the n power.
As you can see here, we are also using a “quanta” factor to calculate the slope of angle 1 × 1. Whoever is familiar with the Gann Angles system has already understood the importance of this subject. This is crucial for a correctly drawn Gann fan. So what we propose is using only one of the above numbers to calculate the slope of the 1 × 1 angle. For instance, if you take the EUR-USD chart, I would use 0.003906, which is equal to 1/256, one of the numbers of 1/2 to the n power.
If you set the slope of 1 × 1 angle, the other angles of the fan are automatically set. There are many special properties of angles 1 × 3 and 3 × 1, but this is not a book dedicated completely to Gann Angles and techniques, and it would not do to discuss in detail topics such as commutative properties, translative properties, and time signals.
Nonetheless, it is worthwhile to briefly state that if you rigorously use the 2 to n power quantum scale, according to the translative property, all of Gann Angles are interchangeable (except for angles 3 × 1 and 1 × 3, which follow another rhythm of growth). You do not have the problem of calculating which factor to multiply or divide to find the slope of angle 1 × 1. It can equally be 1, 2, 4, and so forth, because the angles, using the “quantum” scale, are proportional and interchangeable. The only thing to observe is that if the slope is too steep and the majority of the chart is not covered by the angle, you can use the next value in the 2 to n power scale to shift the angle to another position. So angle 1 × 2 becomes angle 1 × 4, angle 1 × 1 becomes angle 1 × 2, and so on.
Finally, if you take a fan of Gann Angles and you transport it to your favorite stock chart, you will obtain many price-time levels of supports and resistances. Just remember to always let the angles start from a top or a bottom.
- Part of book: Quantum Trading By Fabio Oreste