Trading Articles
PHI-Ellipse Analysis: Fibonacci Geometry for Price Patterns

The PHI-ellipse is a unique Fibonacci trading tool that can only be drawn by a computer. PHI-ellipses identify underlying structures of price moves and circumvent price patterns. When a price pattern changes, the shape of the PHI-ellipse circumventing the respective market price pattern changes, too. Nearly all market price moves follow the pattern of a PHI-ellipse. PHI-ellipses are related to the Fibonacci ratio PHI in a similar way as the Fibonacci summation series, as well as corrections and extensions.
Generally speaking, the ratio of major axis a to minor axis b defines the shape of an ellipse. Ellipses are turned into PHI-ellipses in all cases where the ratio of major axis to minor axis ex = (a ÷ b) is a member number of the PHI series. To make PHI-ellipses work as tools for chart analysis, we have applied a (proprietary) transformation to the mathematical formula that describes the shape of the ellipse. We still consider the ratio of major axis a to minor axis b of the ellipse, but in a Fischer-transformed way, in mathematical terms ex = (a ÷ b)*.
We introduce PHI-ellipses as instruments for investments counter-trending to market action. We observe whether a price move stays within a PHI-ellipse and invest accordingly if a price move breaks out of a PHI-ellipse at the very end. Historical charts show that almost all price moves in commodities, futures, stock index futures, or stocks can be circumvented with a PHI-ellipse. However, finding the correct PHI-ellipse is an art. It takes skill, experience, patience, and trust in the analysis to effectively use PHI-ellipses as Fibonacci investment tools.
It is impossible to forecast the final shape of a PHI-ellipse at the beginning of a price move. As we later prove on various examples, PHI-ellipses may follow one after the other symmetrically. Small PHI-ellipses may be followed by long PHI-ellipses, or PHI-ellipses may be connected with each other, and so on. The challenge is to correctly in-terpret price moves and select PHI-ellipses accordingly. Once investors learn how to identify the appropriate market pattern, working with PHI-ellipses becomes easier.
The remainder of this section is divided into two parts. We first examine the shape and the slope of PHI-ellipses, and include approaches for attaching and overlapping PHI-ellipses. In the second part, we address entry and exit rules for the generation of trading strategies from PHI-ellipses.
Typical Features of PHI-Ellipses
Dealing with chart patterns depends a lot on the definition of swings just as it depends on controlling impulse waves and corrections with-out losing sight of the main trend picture. The strength of PHI-ellipses, in this respect, is that no matter how many waves or subwaves are in a price pattern, we receive a solid overall picture of the total price pattern as long as a PHI-ellipse can circumvent it.
Even if we reduce the analysis to a simple 3-swing pattern, an indefinite number of combinations of impulse waves and corrections will be possible. Impulse waves are fairly simple to handle, whereas dealing with corrections and long sideward periods in the markets can be very tricky. Traders and analysts call these periods “noise” in the markets.
PHI-ellipses are ideal geometrical trading tools for coping with noise and analyzing price moves over time without having to focus too much on every intermediate minor peak or valley between the starting point and the ending point of the price pattern. The best way to demonstrate the generation of PHI-ellipses is by starting with a circle and then turning the circle into PHI-ellipses. A circle is a special kind of PHI-ellipse because the ratio of the major and minor axes is 1.000 from the PHI series. Figure 5.1 shows the process of generating PHI-ellipses.
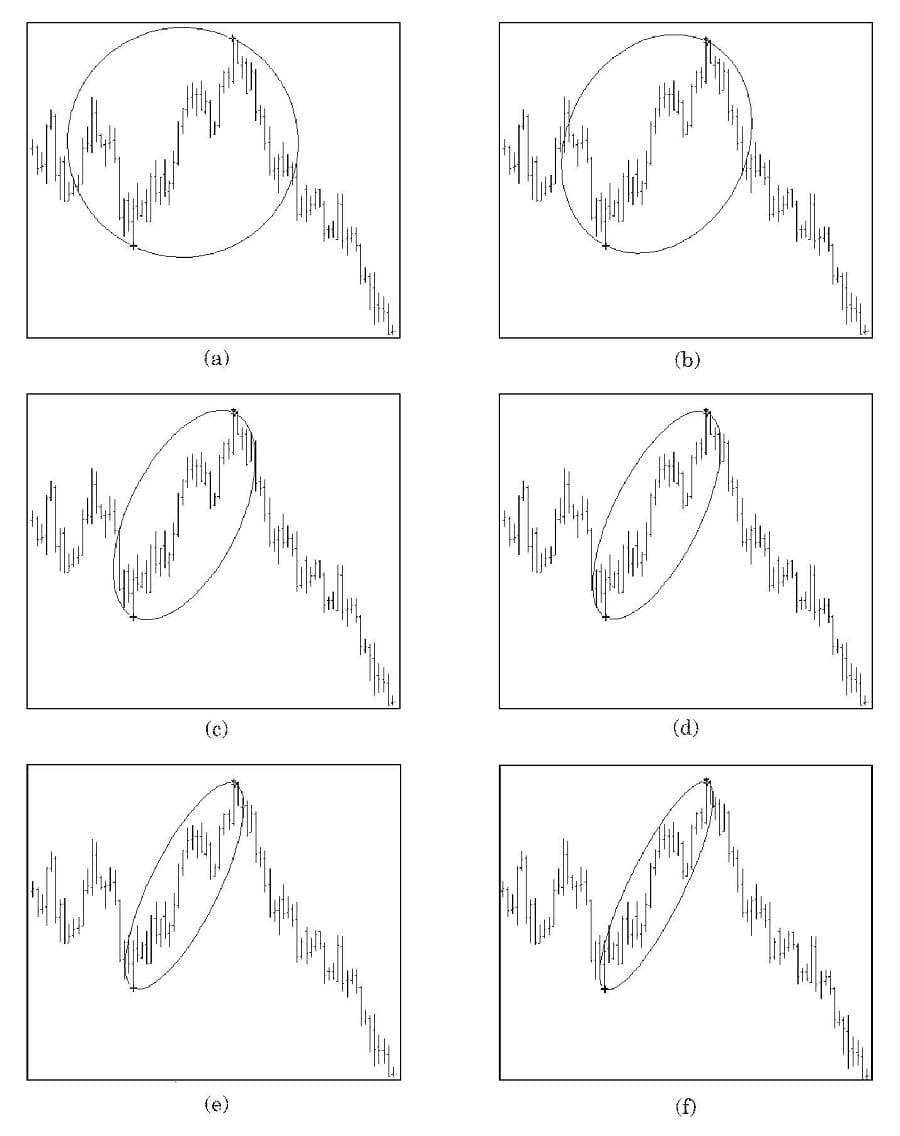
From the circle, ongoing PHI-ellipses can be drawn at alternative axis ratios 1.618, 2.618, 4.236, 6.854, 11.090, 17.944, 29.034, and so on, from the PHI series. According to the mathematical formula for Fischer-transformed PHI-ellipses, the length of the major axis remains unchanged. The minor axis thereby gets shorter and shorter. The resulting PHI-ellipses become narrower and narrower and finally perfectly enclose the entire price move.
It is evident from the sample charts that because ellipses have such special structures, they can only be used on computers and with particular software packages. Fischer-transformed PHI-ellipses, moreover, are unavailable elsewhere and can only be generated by running the WINPHI graphics software that accompanies this book. PHI-ellipses are interesting graphical trading tools because their very structure is founded on a 3-wave pattern, as shown in Figure 5.2.
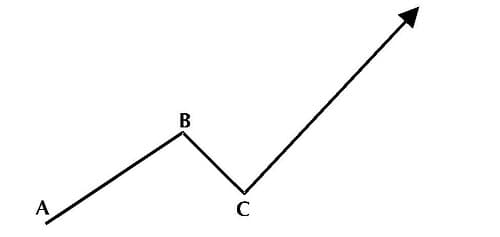
Once we have identified the three points A, B, and C in the idealized 3-wave swing, we can position the PHI-ellipse around these three points. Wave 1 from A to B is an impulse wave. Wave 2 from B to C is the corrective wave to the impulse wave. For wave 3, we expect a second impulse wave in the direction of the first impulse wave. The fundamental structure of the PHI-ellipse provides another way to analyze price moves. Because it is dynamic over time and follows price patterns as they develop, we must be patient and wait—from the very beginning to the very end—until a price move stays within the PHI-ellipse. As soon as the market price moves out of the PHI-ellipse, action is possible, but only if a price pattern runs completely inside a PHI-ellipse until reaching the final point.
As a general rule, if the angle of a PHI-ellipse is sloping upward, we can sell at the end of the PHI-ellipse. If the slope of the PHI-ellipse is downward, we can buy at the end of the PHI-ellipse. The exceptions to this rule are described later. It is important to remember that PHI-ellipses are not means of forecasting market moves. We will never know in advance whether a price move will stay within the PHI-ellipse and reach its end so that we can take action. We must always wait to see if a price move stays inside the borders of the PHI-ellipse, and we cannot take action unless the move meets the final point of the PHI-ellipse. The rationale behind this waiting principle becomes clear in the examples later in this chapter.
Working with PHI-ellipses means watching price action as it progresses. Price action starts with the impulse wave 1 from A to B in Figure 5.2, followed by the correction from B to C. In the discussion of corrections and extensions in this book, Elliott’s wave principles helped us determine that the corrective move is not expected to go lower than the low at the beginning of wave 1. Only in exceptional cases did we consider bull traps and bear traps. With PHI-ellipses, however, we consider all sorts of 3-wave moves as long as we can put a PHI-ellipse around them (see Figure 5.3).
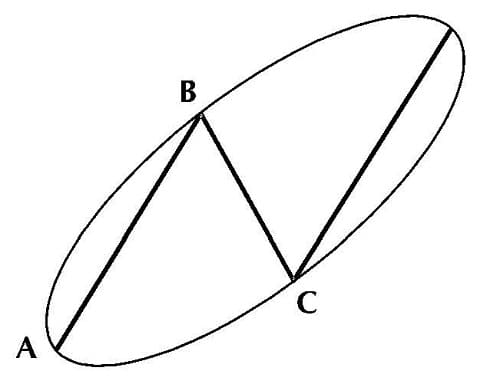
The 3-swing pattern in Figure 5.3 is an ideal picture of a price move, but in reality, waves within a PHI-ellipse may take many forms and magnitudes. As price action progresses, peaks and valleys may touch the outside of a PHI-ellipse several times without destroying the pattern.
We have analyzed and worked with PHI-ellipses for many years, and have found it fascinating to observe the different kinds of price action within PHI-ellipses. Based on the developing price action, PHI-ellipses might need adjustment, which is why working with them takes such discipline. But once investors get used to them, they realize that PHI-ellipses are amazing Fibonacci-related trading tools.
There are many possible price behaviors within PHI-ellipses. According to the appropriate ratio for drawing a PHI-ellipse chosen from the PHI series (see Figure 5.1), PHI-ellipses may be fatter or thinner, longer or shorter. But these facts do not have to worry investors too much, because price action itself shows up before the final structure of the PHI-ellipse. Investors must have tremendous patience and flexibility to wait until market pricing reaches the end of the PHI-ellipse. However, the dynamism and flexibility of PHI-ellipses can also be an investor’s strength, because no other investment tool can make price patterns as graphically visible.
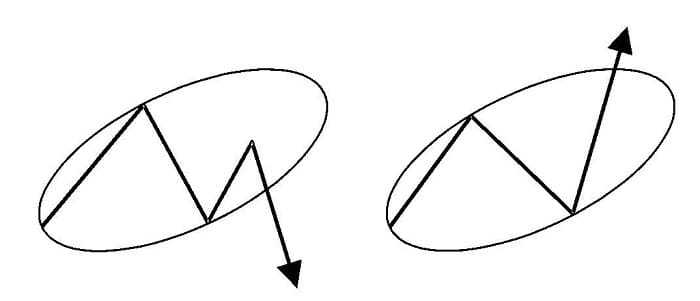
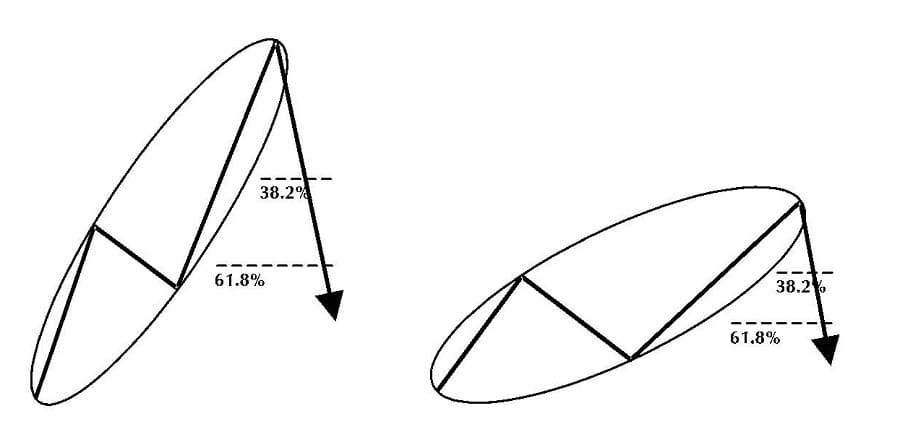
There is no guarantee, only a high probability, that the end of a PHI-ellipse will ever be reached. If the final point of a PHI-ellipse is not reached and market pricing leaves the borders of the PHI-ellipse prior to the end, then we have to reevaluate price action and start looking for the next PHI-ellipse that unfolds. Figure 5.4 shows two typical price movements that do not reach the final points of the PHI-ellipses.
We cannot define a standard PHI-ellipse that suits every product. To work properly with PHI-ellipses as investment tools, we must identify the minimum length and the minimum thickness of relevant PHI-ellipses for every product that we trade. Each product reveals its characteristic price behavior in typical price patterns that we can identify only with historical charts.
The attached WINPHI software package is designed to back-test Fibonacci tools on historical data. It would not be enough to analyze any kind of historical data. It is important to analyze all of the historical data with the same price scale. A PHI-ellipse specific for a certain product can be identified only when the price scale over the test period remains the same. This identification routine has to be done by hand with the aid of computer-graphics capabilities.
Advanced Books and Courses on Technical Analysis


Once the length and thickness of a typical PHI-ellipse for any given product are identified over 10 years or more with a constant price scale, the probability is high that investors can use this PHI-ellipse for future trading. PHI-ellipses tell us where we are in the market price action at any point in time. Whenever a market trend reverses at the end of a PHI-ellipse, we can take the final point of an old PHI-ellipse as the beginning of a new one (see Figure 5.5).
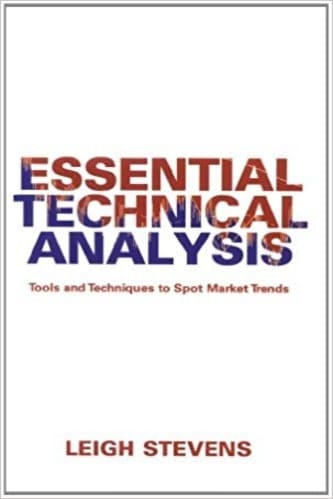
New PHI-ellipses often start to develop as soon as price patterns reach the end of old PHI-ellipses. This occurs especially when PHI-ellipses have a steep upward or downward angle. Since PHI-ellipses work best as countertrend investment tools, sideward markets provide the most favorable price patterns. Whenever market price action moves out of a PHI-ellipse be-fore reaching the final point of the PHI-ellipse, either to the upside or to the downside, we can assume a new market price pattern is beginning that might fit into a new PHI-ellipse. In addition to attaching PHI-ellipses, we may also find overlapping PHI-ellipses as shown in Figure 5.6.
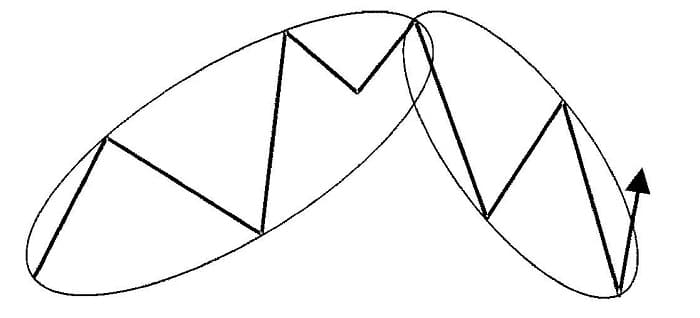
The slope of a PHI-ellipse is another parameter that traders must not underestimate. This slope determines the profit potential of countertrend trading signals from market entry point to profit target (see Figure 5.7).
The slope of a PHI-ellipse often is small, as can be expected in sideways markets. In these cases, the beginning of a new PHI-ellipse and the end of an old PHI-ellipse are likely to overlap, as can be seen in Figure 5.6. Monitoring the slope of a PHI-ellipse is important. Like the countertrend moves at the end of extensions, retracements of 38.2 percent or 61.8 percent at the points of major trend changes in the markets should go back in the direction of the initial impulse wave.
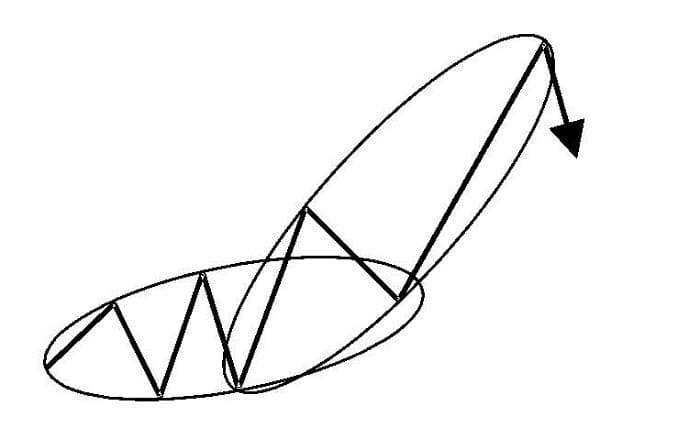
The steeper a PHI-ellipse develops, the larger the distance becomes from wave 1 to the final point of the PHI-ellipse. The greater the distance becomes from wave 1 to the final point of the PHI-ellipse, the larger the profit potential in points on 38.2 percent or 61.8 percent retracements to this distance. In addition to circumventing chart patterns in an actual or short-term trend, PHI-ellipses may also circumvent the bigger picture from a long-term perspective. This might include a couple of smaller trend changes (see Figure 5.8).
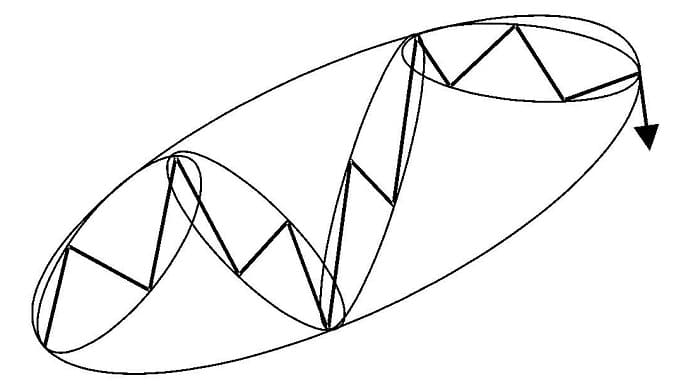
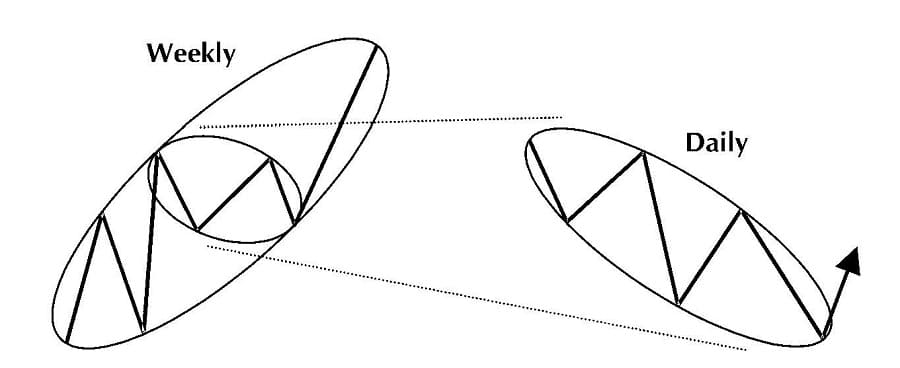
Investors who use PHI-ellipses must monitor price moves consistently. This is a minor problem on weekly and daily data, but on intraday data, there is a lot of pressure to identify and to wait for the end of a PHI-ellipse. Therefore, PHI-ellipses on an intraday basis have to be handled with care and can only be recommended for experienced Fibonacci traders. Simultaneously analyzing the same product on weekly and on daily data often benefits the outcome of the analysis. For example, recognizing a PHI-ellipse with a strong uptrend from weekly data will help to identify the correct trading signals in daily data. Figure 5.9 illustrates the latter notion.
To identify the best average PHI-ellipse for any given product requires a software package like our WINPHI program, which allows investors to draw any PHI-ellipse desired on sets of historical data and on a constant price scale. Once traders have identified the PHI-ellipse for any particular product, they can apply it to real-time trading. Identifying specific PHI-ellipses is like pattern recognition in the markets. Pattern recognition has an advantage, however, because stable price patterns detected on historical price moves have a chance of repeating and can become trading indicators for the future.
- Part of book: Candlesticks, Fibonacci, and Chart Pattern Trading Tools By Robert Fischer & Jens Fischer
thank you
After all I got a webpage from where I can actually take helpful data regarding my study and knowledge.