Trading Articles
Geometric Market Projections Using the One-Two Right Triangle

A simple right triangle may be used as a template for illustrating important market moves. It is also the basis for generating additional, more complex templates. This particular right triangle has one leg twice the length of the other leg. Therefore, it is termed The One-Two Right Triangle. This triangle has unique properties, particularly in relation to Pi and fractional components of Pi (3.14159). A few of these are demonstrated in the following pages. These properties graphically illustrate geometric relationships between market moves as long as 40 years, many of which are perfect to the exact trading day.
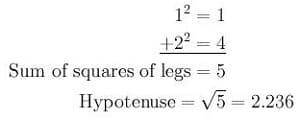
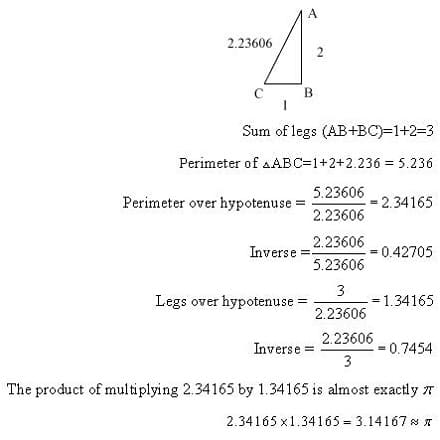
Assume a right triangle: a value of 1 on one leg, a value of 2 on the other leg. The hypotenuse is easily determined with the Pythagorean theorem, which states that the hypotenuse of a right triangle is equal to the square root of the sum of the squares of the other two sides.
A Brief Look At Some Of The Unique Properties Of The One-Two Right Triangle
The ratios between the sides, hypotenuse, and perimeter of the triangle are shown below. Of particular interest: The product of multiplying the ratio of the perimeter over the hypotenuse by the ratio of the legs over the hypotenuse is 3.14167; approximately Pi. In addition, scaling some of these ratios by one thousand yields a value equal to the number of trading days in important market moves.
Compound Pivots and Balance Points
Ermanometry principles apply to every freely traded market. The material herein only covers the DJIA and S&P 500. When these two indices are rising or falling in concert but reach an important intraday extreme and reverse on different days, both days are considered pivotal, and together are termed a Compound-Pivot. The midpoint between the two pivotal days is an Ermanometry Balance-Point. Balance-Points are an extremely important tool in Ermanometry. Example: In constant dollars, the DJIA high from 1932 was in 1966; the S&P high was in 1968. From these peaks, both indices declined until 1982. Trading days from the Balance-Point of the 1966-1968 Compound-Pivot to the August 25, 1987 top equal 5083. 3.1416 × 1.618 × 1000 = 5083. The product of two mathematical constants produced a major market move, starting with a Balance-Point.
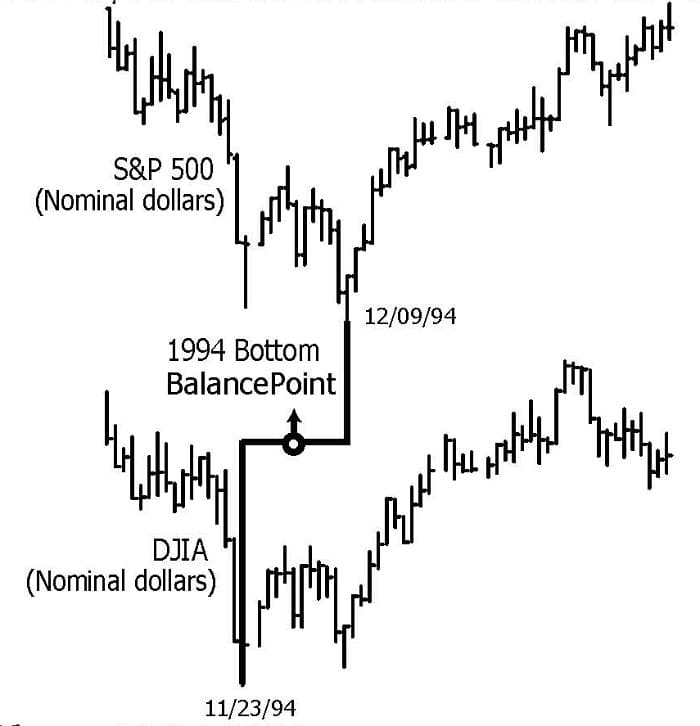
The last three months of 1994 saw the DJIA and S&P form a final consolidation area prior to a meteoric rise to historic highs in 2000. The DJIA intraday low for this period was on November 23rd, and the S&P intraday low was on December 4th. This created a Compound-Pivot and Balance-Point. Daily bar charts for both indices illustrate the derivation of the 1994 Balance-Point.
S&P 500 Bar Chart, 1987-2000
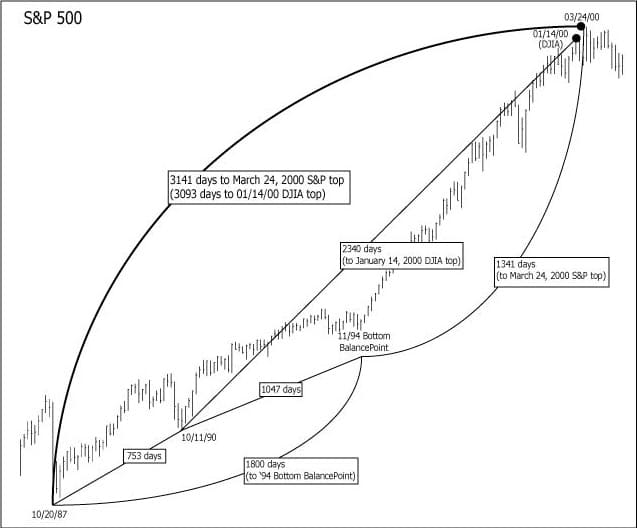
The monthly bar chart of the S&P 500 on page 5 covers the period from the October, 1987 “crash” low to the 2000 tops. It includes the trading day numbers between the pivotal 1987- 1990-1994 BalancePoint lows and the 2000 DJIA and S&P tops.
The One-Two Right Triangle And The 1987-1994 BalancePoint 1800 Day Move
The legs of this triangle total 1800 (600 and 1200), representing the 1800 day move from the 1987 low to the 1994 BalancePoint. This generates a hypotenuse of 1341.6.
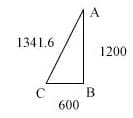
Total days between the 1994 BalancePoint and the 2000 S&P top is 1341. Page 2 shows the ratio of the sum of the legs over the hypotenuse: 1.34165. The perimeter of the triangle is 3141.6. This is π scaled (multiplied by 1000):
![]()
Total days from the 10/20/87 low to the 03/24/00 S&P top is exactly 3141 days. The hypotenuse of this triangle, 1341.6, is the time distance from the 94 bottom BalancePoint to the 03/24/00 top. Downscaling the hypotenuse value, 1341.6, by a factor of 100 gives us the ratio 1.3416. Please recall that in any one-two right triangle 1.3416 is the ratio of the sum of the legs’ value divided by the hypotenuse value. Downscaling 1800 by the same factor produces the ratio 1.8. The square root of 1.8 is 1.3416.
![]()
Figure 1 illustrates the importance of the CompoundPivot/BalancePoint Principle. Without the BP there would not be a move of 1800 days. Figure 1 also illustrates some interesting relationships between ratios and market moves. Most important of all, it illustrates how an important market move can be geometrically related to a future move.
Advanced Books and Courses on Technical Analysis


Additional Attributes of 1800
Following are a few examples where 1800 is involved with major market moves, using its inverse, its square root, and also, scaling 1800 and then deriving its square root. Of course, 1800 is also important in multiple geometric relationships.
a. ![]()
b.
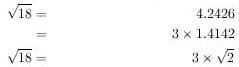
![]()
This is of interest because 4.2426 equals 3 x 1.4142, the square root of 2.
c. The inverse of 1.8 = .5555
![]()
d. The number of days between the October, 1987 low and the January, 2000 DJIA top = 3093 days. This is a “repeat” of the move between the ‘62 – ‘74 S&P bottoms.
e. Downscaling the square root of 18 by 10 gives us 0.42426.
![]()
0.5555 is the inverse of 1.8.
f. August 9 and August 12 create a three day CompoundPivot at the 1982 bottom.
g. The number of days between 08/12/82 and 10/20/87 = 1312 (e. above)
The number of days between the 1982 bottom BP and the 08/13/04 S&P low is 5555 (c. above).
h. The number of days between the 1987 bottom and the 08/13/04 S&P low is 4242 (b. above).
1047-2094 One-Two Right Triangle and the 2000 DJIA Top
On the monthly bar chart of the S&P, the number of total days between the 1990 low and the 1994 bottom BalancePoint is shown; 1047 days. The total days are the same for the DJIA.
![]()
Placing 1047.2 on the short leg of the One-Two Right Triangle makes the long leg 2 × 1047.2 = 2094.4. The sum of the legs is 3141.6, or π × 1000.
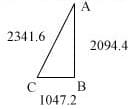
The hypotenuse is 2341.6. Please recall from the beginning of this material that in any One-Two Right Triangle, the perimeter over the hypotenuse=2.3416.
![]()
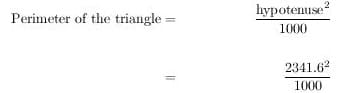
The perimeter of this triangle is 5483.
![]()
Therefore, the square of the hypotenuse, (2341.6 × 2341.6) ÷ 1000, is the perimeter of the triangle.
The total days from the 10/11/90 low to the DJIA 01/14/00 top are 2340. This is an error factor of only one day, if 1047 and 2094 are the legs used to generate the hypotenuse 2341.
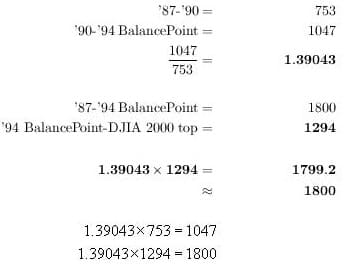
If we assume a move of 2341, one more trading day than the actual 2340 day move, the time distance from the BalancePoint to this assumed day would be 1294 days; 2341 minus 1047. We are using this “assumption” to illustrate additional close relationships between the two 2000 tops and the 1800-day ‘87-’94 BalancePoint move. We will see that the ratio between the two major moves of 753 days and 1047 days, which together comprise the 1800-day move from ‘87 to ‘94, is almost perfectly equal to the ratio between the two major moves from ‘87 to 2000, 1800 and 1294.
The Phi Connection
The Golden Mean is almost always present in market moves. The One-Two Right Triangle is an important element in geometrically illustrating the Golden Mean. For now we’ll merely take a quick look at the 2.3416 ratio (introduced on Page 3, it is the ratio of the perimeter of the one-two right triangle over the hypotenuse).
![]()
Of course you recognize 3.236 as twice 1.618. In case 1.382 does not look familiar, remember that 0.618 squared = 0.382, and 1.382 × 1.618 squared = 3.618, and
The 1800 Day Move (1987 – 1994): Its Relation To The October, 2002 Bottom
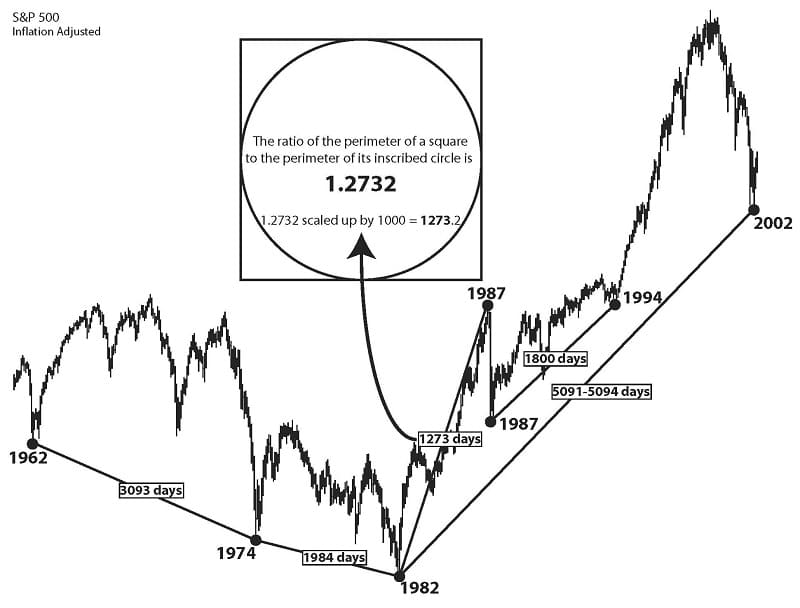
Please note the chart below. This chart shows the time spans (in trading days) between the lows of 1962-1974-1982-1987 (top) -2002. These moves are illustrated because of their ultimate connection with the 1800 day move (1987 low – 1994 bottom BalancePoint) already shown to be instrumental in projecting the DJIA and S&P 2000 tops.
First, the genesis of the 1273 day move between the August 12, 1982 bottom and the August 25, 1987 top:
- There are 3093 days between the 1962 and 1974 S&P bottoms, and 1984 days between the 1974 bottom and the August 12, 1982 bottom.
- The ratio between these two moves is .64145.
![]()
Continuing as a three term proportion (such as 2 is to 4 as 4 is to 8):
![]()
Or,
![]()
There are 1273 days between August 12, 1982, and the August 25, 1987 top.
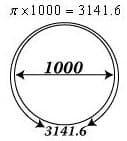
Thus, the three contiguous moves, between 1962 – 1974 (3093 days), 1974 – 1982 (1984 days), 1982 – 1987 (1273 days) are each directly proportional to each other. Three and four term continuous proportions connecting major market moves occur very frequently in the markets. The 1273 day move has additional significance because it is a geometric constant. The circumference of a circle is its diameter multiplied by Pi, approximately 3.14159. Assume a circle, diameter 1,000. The circumference of this circle is 3141.6:
Assume the circle is inscribed within a square.
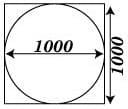
When a circle is inscribed within a square, each side of the square is equal to the diameter of the circle, or 1000.
The perimeter of the square is 4,000.
The ratio of the perimeter of the square divided by the circumference of the circle: 4000 divided by 3141.6 = 1.2732
![]()
1.2732 x 1000 = 1273, the 1982 -1987 move. Thus this move is a fundamental geometric constant scaled by 1000.
The advance from August, 1982 to August, 1987 is perfectly proportional to the moves between the three previous major bottoms. It is also a scaled geometric constant.
Assume a square with sides of 1273.2, the ratio of the perimeter of a square to the circumference of its inscribed circle x 1000.
This square’s perimeter is therefore 5092.8, 4 × 1273.2.
There are 5091-5094* trading days between the 1982 bottoms and October 10, 2002 bottom. This is equal to the perimeter of the square, and 4 times the 1273 day advance from the 1982 bottom to the 1987 top.
*There are multiple good reasons to use both the 8/9/82 and 8/12/82 bottoms in our work.
The diagonal of any square is 1.4142 (the square root of 2) times the length of one side of the square.
The diagonal of this square, with sides of 1273.2 = 1800.6.
The 1800.6 diagonal is the “1800 day move connection” to the 2002 bottom. The diagonal is .35355 x the perimeter of the square, 1.4142 divided by 4.
The inverse of .3535 = 2.8284, or 2 x 1.4142.
Total days between the 2000 S&P top and the 2002 low equal 638. (03/24/00 was the date of the all-time high of the S&P 500.)
The relationship of 1800.6 diagonal to the 5092.8 perimeter in Fig. A may also be graphically shown as below in Fig. B:
1800.6 is one side of square ABCD; 5092.8 is the diagonal BG of square BFEG with sides of 3601.2, CD, twice the size of square ABCD.
Now let’s come back to the one-two right triangle:
In Fig. C the diagonal of 1800.6 from Fig. A is now the short leg of one-two right triangle ABC. Triangle ADC is an isosceles right triangle (two equal legs), and the 5092.8 perimeter of the square, Fig. A, is the hypotenuse.
Not An Isolated Example!
Billions of decisions made by millions of people move the markets every day. It is perfectly natural to assume randomness; to further assume markets could not be naturally perfect. It is comfortable to look at the preceding examples as random coincidence. Empirical evidence from within the markets provides literally hundreds of examples disproving coincidence, but this is neither the proper time nor place to present them. However, one additional example is included because of its similarity to the geometry detailing the relationship between the 1800 day move (1987 – 1994) and the 1982 – 2002 move.
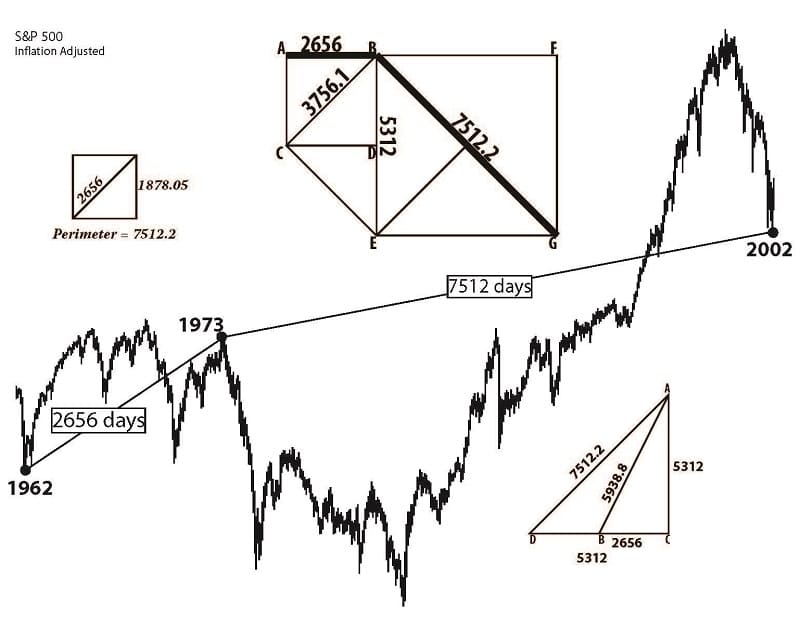
In the following example the geometry illustrates the relationship between the 1962 – 1973 and 1973 – 2002 moves. This forty year span is “perfect” to the day. Other examples illustrate this degree of accuracy for periods longer than seventy years.
There are 2656 days between the 1962 bottom and the 1973 nominal price top. There are 7512 days between the 1973 top and the October, 2002 bottom.
1800.6 and 5092.8 are values used in the previous examples. The ratio between them is 2.8284, which is twice 1.4142, the square root of 2.
2.8284 x 2656, the 1962 – 1973 advance, = 7512.2. There are 7512 days between the 1973 top and the 2002 bottom.
The chart on the following page illustrates the application of these geometric principles to these market turning points in 1962, 1973, and 2002.
If you think the immediately preceding examples merely illustrate the same thing in different ways, you are correct. However, visualizing market moves in various geometric configurations, no matter how simple, is a first step toward understanding more complex market structures. We’ve seen how the 1800 day move is related in simple and significant ways to many other important market moves. Ermanometry CompoundPivot and BalancePoint principles made it possible to identify the 1800 day move. You have already seen how this move is critical for precise market analysis. CompoundPivots and BalancePoints are a giant leap forward in decoding the markets and generating profits.