Trading Articles
Median Lines in Andrews Pitchfork: Market Flow and Symmetry Analysis
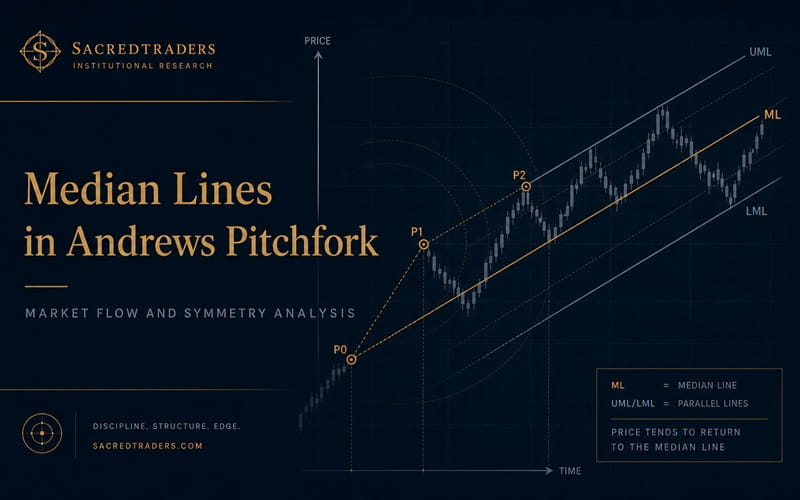
The median line (ML) is the line that joins the anchor (P0) with the middle of the P1−P2 swing. The forerunner of this line first appears in the work of Roger W. Babson (1875−1967) in the first decades of the twentieth century. Babson successfully used his charts to forecast the October 1929 stock market crash, well ahead of the event. Its precise name was the Normal Line; on a Babson chart its presence delimited the market flow in two territories:
- above the line, where prosperity reigned,
- below the line, where depression surged.
Median Lines and Pitchfork
The late Dr Alan Hall Andrews, being passionate about Technical Analysis, attended Babson’s Action and Reaction Newtonian Principle seminar. In the early 1960s, Andrews organized the essence of this concept into a 60-page course, naming it the ‘Action-Reaction Course’ as a tribute to Roger Babson. His work − described as the Median Line Method − showed drawn median lines on the charts and, as they resembled a pitchfork, these became known in most of the charting programs as the Andrews pitchforks.
The essence of a pitchfork resides in its median (ML) and accompanying lines: U-MLH, L-MLH, WL, TL, etc. The lines parallel to the ML, through the P1 and P2 pivots, form the upper median line (U-MLH) and the lower median line (L-MLH). (The letter H in this annotation is inherited from our 20th century teachers, indicating the parallelism of the two vertical lines of the letter H and those of MLHs.)
The median line is a virtual link between the trader and the market enhancing the understanding of the pitchfork’s role. Without the ML the pitchfork would be just another channel. It could even be said that the pitchfork is the ‘most noble of the channels’.
The median line is the main component of a pitchfork’s framework, not only linking the anchor to the midpoint of the P1−P2 swing but also constituting a foundation guideline for drawing its subordinates: the upper and lower median lines, warning lines, Fibonacci lines and sliding parallel lines (more about these can be found in Chapters 5, 7 and 14). The constructed median line will also project into the price−time virtual space, the immediate past and the current market flow, as it is formed by the specific choices of anchor (P0) and the corresponding P1−P2 swing.
MAGNET-LIKE EFFECT AND SYMMETRY AXIS POWER
Dr Alan Andrews suggests that the median line’s main role is to attract the market price. He taught his students that the price has a very high probability to return to the median line. Thus, the median line becomes the minimum price objective. It is one of the best components of the pitchfork and the most powerful in optimally describing the market flow. In order to confirm the optimal description of the market flow, we look for:
- multiple tests; as experienced traders would say: ‘The final indicator is a tried and tested trend line’.
- symbiosis between the market price and the median lines responsible for: 1. restored energy through the energy-building rectangles; 2. energy consumption in the process of building huge bars and swings.
The median line can be an excellent symmetry axis for the price which:
- mirrors the most dominant trend (usually a major pitchfork); or
- runs parallel to the minor trend’s axis (a minor pitchfork).
The median line may play a support role (in down-trending), or a resistance role (in up-trending). An old support can rapidly become a new resistance and vice versa.
MEDIAN LINE-RELATED MARKET STRENGTH OR WEAKNESS: DOUBLE SIX PARAMETER RULES
The median line can be used to evaluate the degree of the strength or the weakness (double six parameters) of the ongoing market. These features are extremely important for trading decisions, and can really change the outcome of the trading results.
Six Parameter Rules: Characteristics of ML-Related Up-Sloping Momentum
- No potential resistance ahead (the path of least resistance).
- A certain type of penetration of the ML or U-MLH with huge bars; prices close in their upper bars’ level (above 50%), as high as possible from these lines. We can conclude: the higher the close, the stronger the upward momentum of the trend.
- The gap over the ML is a sign of strength. Its magnet-like power will draw the price backwards, and try to fill the gap. The absence or scarcity of strong resistance levels situated ahead of the market, facilitates the upward conquering of this path of least resistance.
- No testing of any MLs or L-MLHs belonging to any other pitchfork structure.
- We have the effect (strong upward momentum) but not the cause even if the source of this strong momentum is obvious: a stationary trading range forming an energy cluster lying on the L-MLH or farther up on the ML.
- The ML of the market context and the ML of the upper time frame are both upwardly- oriented, in sync with the direction of the trade.
Six Parameter Rules: Characteristics of ML-Related Down-Sloping Momentum
- No potential support below (the path of least resistance).
- A certain type of penetration of the ML or L-MLH with huge bars; prices close in their lower bars’ level (under 50%), as low as possible from the mentioned lines. The lower the close location, the stronger the down-sloping momentum will be.
- A gap underneath the ML is a sign of weakness. There is a strong probability that its magnet-like power will draw the price backwards to try to fill the gap. The absence or scarcity of strong support levels situated beneath this down-sloping market facilitates the price sinking through the path of least resistance.
- No testing in view of any MLs or U-MLHs belonging to any other pitchfork structure.
- We have the effect (high-velocity downward momentum) but not yet the responsible chart formation. The probable cause is the resident trading range energy cluster lying on the U-MLH or farther down on the ML.
- The ML of the market context and the ML of the upper time frame are both oriented downwards, in sync with the direction of the trade.
USING THE MEDIAN LINE: CASE STUDIES
1.German Dax Futures Index Charts
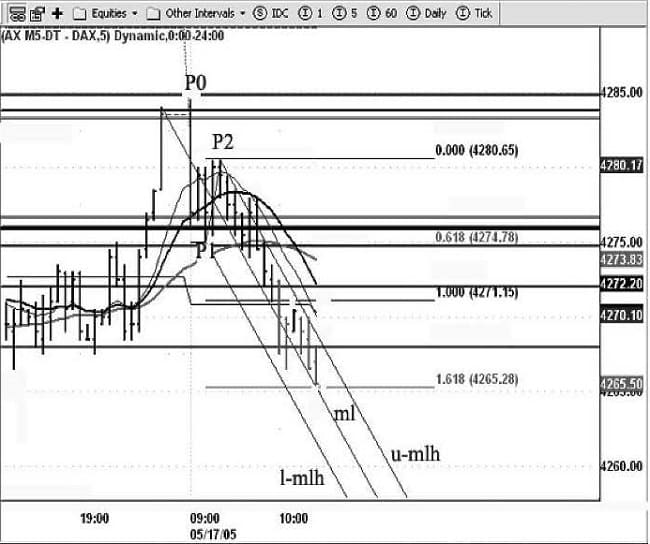
Figure 3.1 illustrates the attraction that the ML has for the market price. After the ML has been tested three times (observe where the price touches the ML, just before the up-sloping failure), the price drops and closes right on the L-MLH.
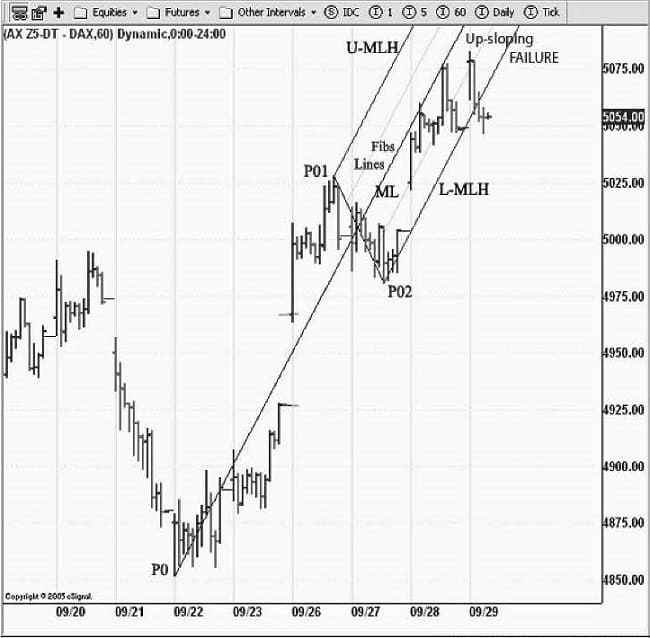
In spite of this upward trend, the following morning’s opening cannot exceed the high of the day before, and it closes as it opened, making a typical ‘uncertainty’ bar (open and close at the same level). This bar signals the market’s indecision for an up or a down bias, and illustrates its inability to reach the ML; as a result, an up-sloping failure is formed.
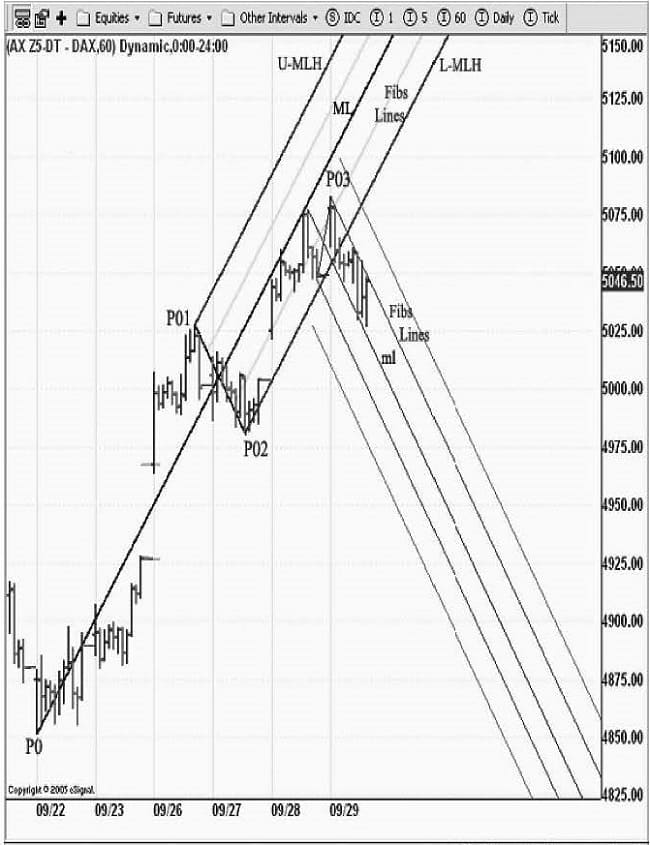
Figure 3.2 shows the continuation of the morning’s down-sloping movements. The P03 pivot failure does a great job, rapidly turning the market downwards with a textbook reversal bar. The down-sloping move illustrates the magnet-like attraction of the ML for the down-sloping pitchfork. The market takes the path of least resistance through the channel formed by the median line and the upper median line of the down-sloping pitchfork.
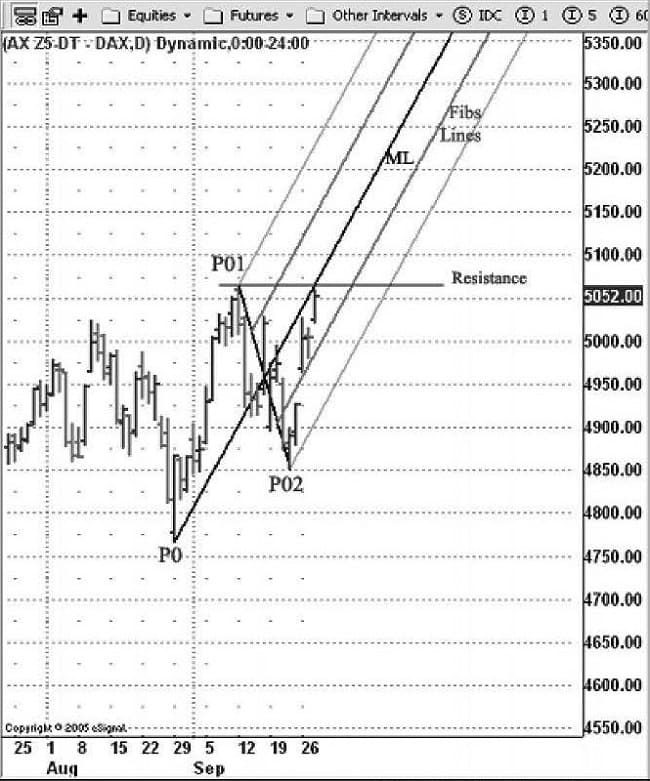
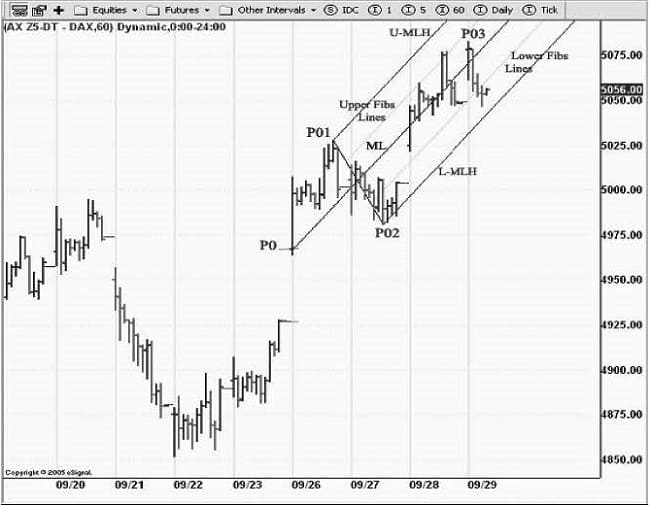
The magnet-like attraction of the ML is obvious on the daily chart shown in Fig. 3.3. The price tests the ML twice, reaching the level of the horizontal resistance at the P01 level. The two preceding gaps and the two small pullbacks (minor pivots), tell much about the high upward potential of the ongoing market; for the trader, a conservative approach would be to adopt ‘a wait and see’ attitude. The market is more likely to continue the up-sloping trend than to reverse, especially as the close of the last bar close is near its high. A glance at the volume indicator would tell more about how to project the next move. (Note: The snapshot of the chart in Fig. 3.3 was taken before the end-of-day.)
The daily chart illustrated in Fig. 3.4 completes the previous chart (Fig. 3.3), being printed at the end-of-day. It can easily be seen that the price has broken the horizontal resistance of the P02 (p01) pivot level, and closes just above it. As mentioned above, the market has had high momentum, capable of breaking the strong resistance at the confluence of the p0-p01-p02 pitchfork ML and the P02 (p01) horizontal resistance.
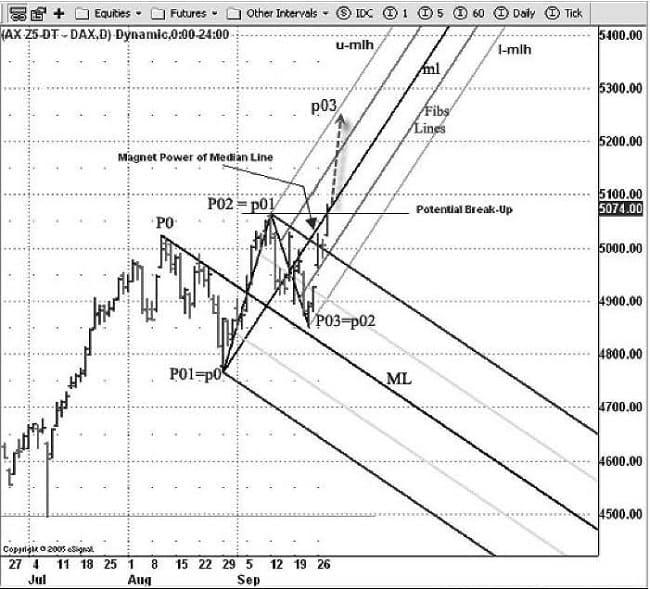
Note: It would have been a great help if the following lines of the P0-P1-P2 down-sloping pitchfork had been drawn: the external upper Fibonacci lines and the warning line (WL-1). The minimum objective of the p02−p03 swing would be the measured distance of the p0−p01 swing.
Advanced Books and Courses on Technical Analysis


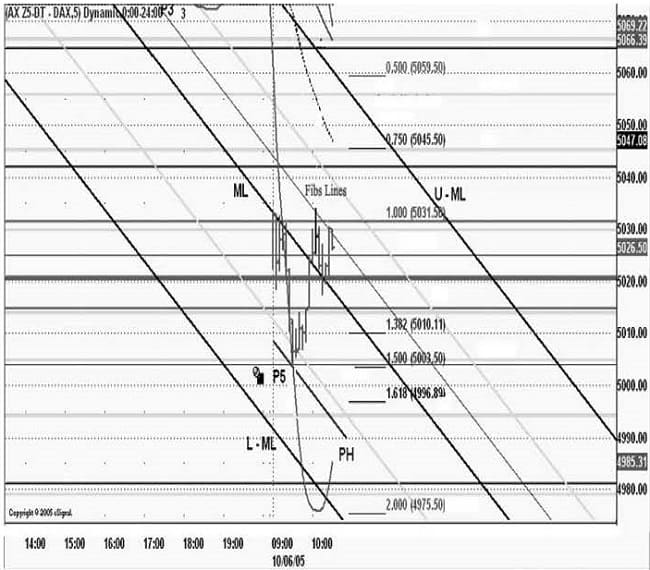
The creation of the P5 pivot movement illustrated in Fig. 3.5 takes advantage of the morning’s news announcement. The large market gap of 56 points lands the price right under the down-sloping ML − again demonstrating the magnet-like power of the median line. The gap is substantial, being even greater than the daily average trading range, which is currently around 50 Dax points. The path of least resistance is blocked here at the 5020 key level (a former big gap). Thus, the move of the down-sloping pitchfork’s P5 pivot cannot totally profit from the inertia created by the huge momentum of the morning’s news. A 10-point trading range is rapidly formed (20% of the trading range). This energy-building range is ideal for restoring the partially-exhausted energy of the market price. The location of the final P5 pivot and the presence of this trading range lead us to believe that the market will quickly reverse. Moreover, the nearness of the gap has the ability to vacuum-up the price, thus accelerating the filling of the gap phenomenon, through the ‘rubber band’ effect.
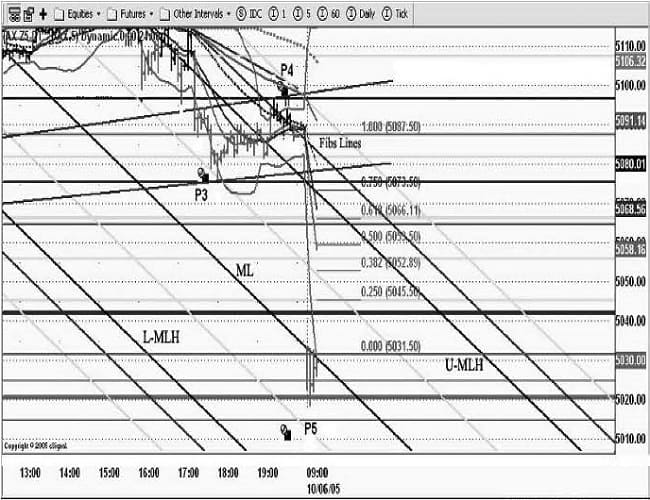
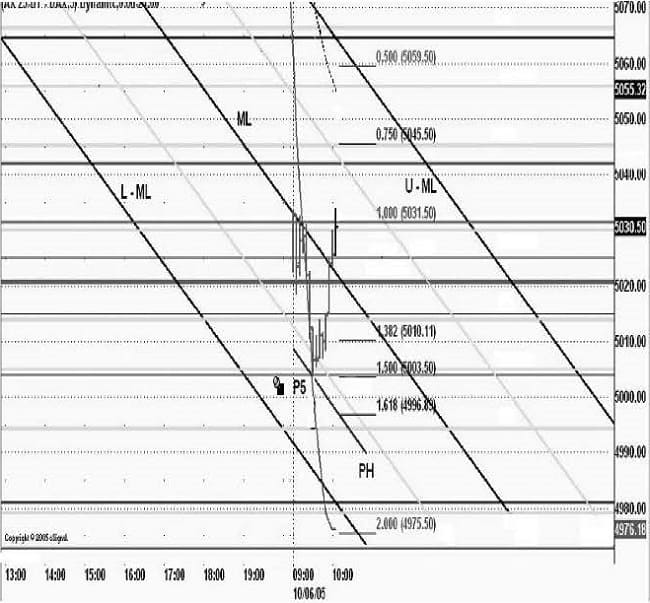
Figure 3.6 continues the story. In spite of the downward, heavily-guarded horizontal fence (5020 key level), the market drops almost twice the height of the preceding trading range. Another energy-building rectangle of the same height has formed.
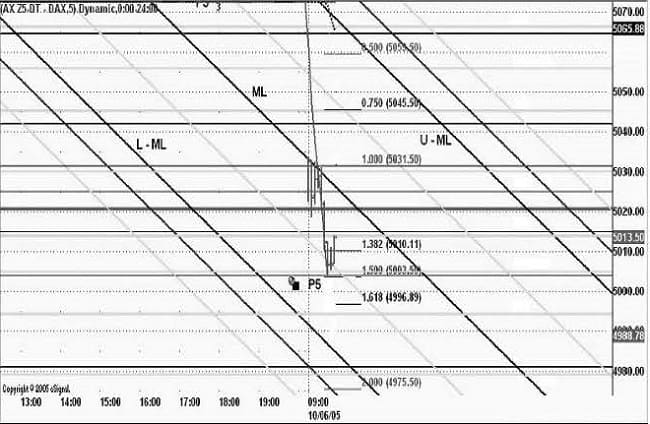
Figure 3.7 shows how, finally, the market reverses and an up-sloping trend begins. The latter rectangle greatly restores the kinetic energy of the market flow. Very sharply, the market regains the lost ground by the height of almost three rectangles from the low of the huge gap.
The deciding level is at the low of the morning gap (5020 key level). Once the market closes above it, the path of least resistance appears more appealing to the trader, even if another smaller and older gap (5031.50 level) could temporarily endanger the wellbeing of the up-trending market development.
Our market closes above the down-sloping ML, ready for its final destination, the upper median line (U-MLH). We should be prepared to draw a new ML as soon as the present swing is terminated.
As we anticipated, the 5031.50 level (a small, older gap) causes a temporary obstacle in the development of the up-trend (Fig. 3.8). In order to be able to climb − and also to fill − the 56-point gap, the market needs to restore much more energy than it has already acquired. The more the price restores energy, the higher and the quicker the upward momentum will be.
It would be interesting to evaluate the quantity of the restored energy needed to fill the 56-point gap. How can this be done? By studying energy rectangles built in the past, and comparing their corresponding gap fillings. We should take into consideration:
- their height;
- their time length;
- how many gap points were filled, together with how many bars it took to build these energy rectangles in a specific time frame.
Of course, all this should be evaluated without any interference from external market factors such as news, the fundamentals (crude oil, gold and interest rates), currency markets, etc.
The median line shown in Fig. 3.9 forms a real symmetry axis. The up-trending market flow moves in a sinusoidal cycle around the ML, from below to above, several times. The channel formed by internal upper/lower Fibonacci lines guides the market’s tremendous potential momentum upwards.
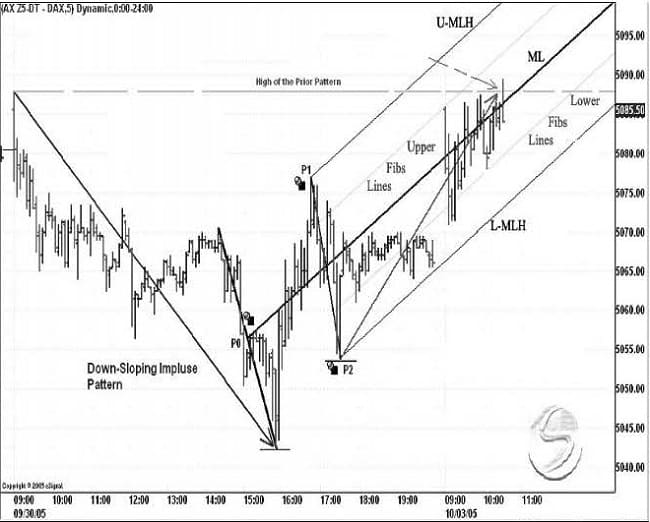
Figure 3.10 shows the same chart as in Fig. 3.1 which had an ML anchored at the chart’s low (4850 level), illustrating the magnet-like attraction of its ML. By changing the location of the anchor (P0) to the high of the gap, Fig. 3.10 illustrates a different feature of the ML: the symmetry axis.
The beginning of the pitchfork illustrated in Fig. 3.11 shows first a market flow, perfectly guided in a channel formed by the ML and the U-MLH. The size of the channel is then doubled, and the flow glides along another railroad-like structure, bordered by the two parallels to the ML, through the P3 and P4 pivots.
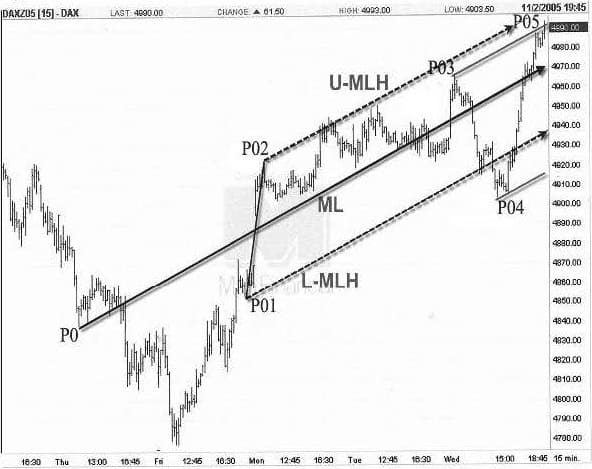
Figure 3.12 shows that the testing of the ML in the pitchfork on this 5-min chart is almost continuous. The magnet-like power of the ML is stronger than ever.
KEY LEARNING POINTS
– The main component of a pitchfork, which optimally describes the market flow, is the median line (ML).
– Main characteristics:
- magnet-like power;
- minimum price objective;
- excellent symmetry axis;
- triple action potential: reversal, violent piercing and range;
- zooming and piercing;
- test and retest;
- failures;
- ML-related market strength/weakness (double six parameter rules);
- other functions of ML (seven parameter rules).
– Construction: joins the anchor (P0) to the midpoint of the P1−P2 swing.
– The trader should routinely compare the position of the market flow with regard to the median line while selecting the optimal pitchfork. We prefer it when the market flow evolves above the median line rather than beneath it.
– The magnetic power of the ML is much greater than that of its parallels.
Ensure that you have understood and assimilated the two most important aspects of the ML:
- The principle of its magnetic power and the minimum price objective.
- The concept: ‘The final indicator is a tried and tested trend line’.