Trading Articles
Bar Grouping Technique for Multi-Timeframe Price Analysis
Short-term trends may be seen on an hourly or daily chart. Intermediate trends may manifest more clearly on a weekly chart, while long-term trends show up nicely on the monthly charts. Having more than a single perspective of trends, as well as support & resistance, provides extremely valuable information for making trading decisions. For example, if you are trading based on the daily chart, the trend lines on the weekly and monthly charts can be very useful in planning your entries.
For example, if the weekly trend is UP and the market is experiencing a short-term decline on the daily chart, selling short is probably not the best strategy. You would be much better off to look for potential support areas to enter long positions in the direction of the bigger trends. On my hand drawn charts, I will often use a technique called “bar grouping,” where I draw the larger trading bar around the smaller. This way I can easily see the smaller trends that are riding on the larger trends.
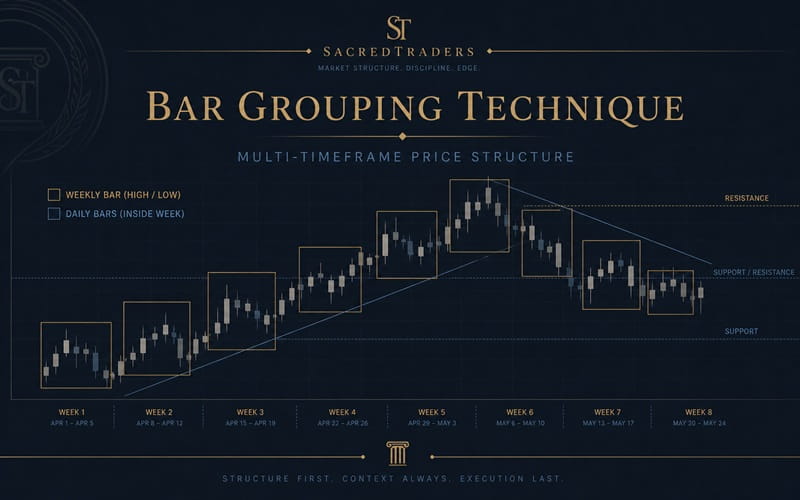
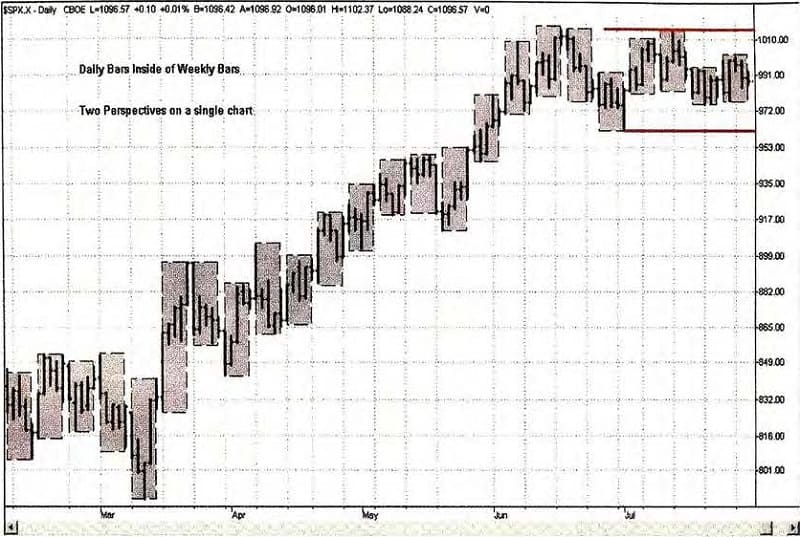
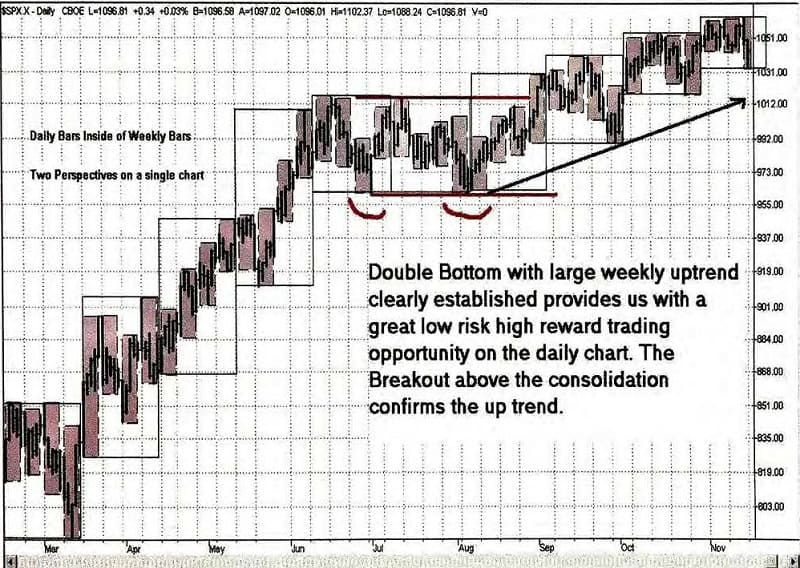
The technique is simple and only requires you to define how many bars are in each group. For example, you could make a 3-day group if you wanted to see a daily chart inside a 3-day chart. You could make a 5-day group to see the daily inside the weekly or a 20-day group to see a daily inside a monthly, etc. The following example should illustrate the method clearly. For this example, I used TradeStation’s rectangle drawing tool to manually group each set of 5-bars together, allowing us to see the weekly chart and the daily chart together. The boxes are drawn based on the high and low for the week creating another bar chart.
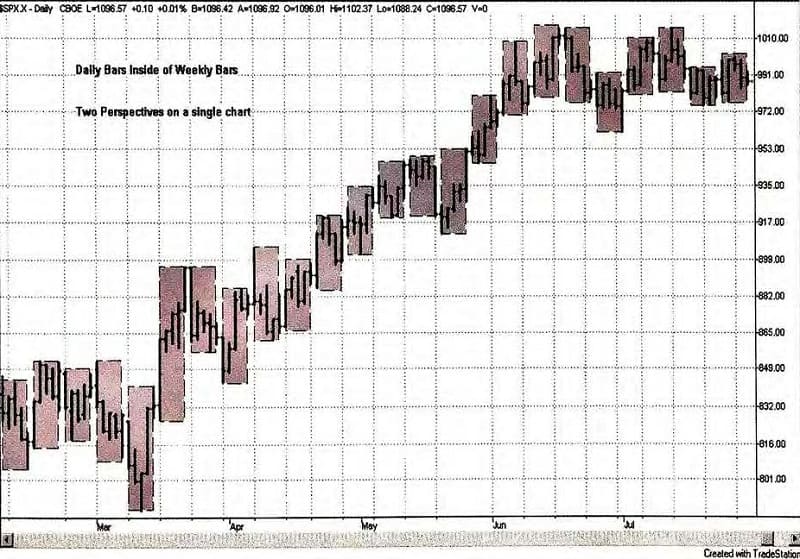
Bar grouping is a simple but very useful technique that provides a multi-perspective view to your charting analysis. For example, would you have spotted the 4 to 5 bar consolidation pattern without this view?
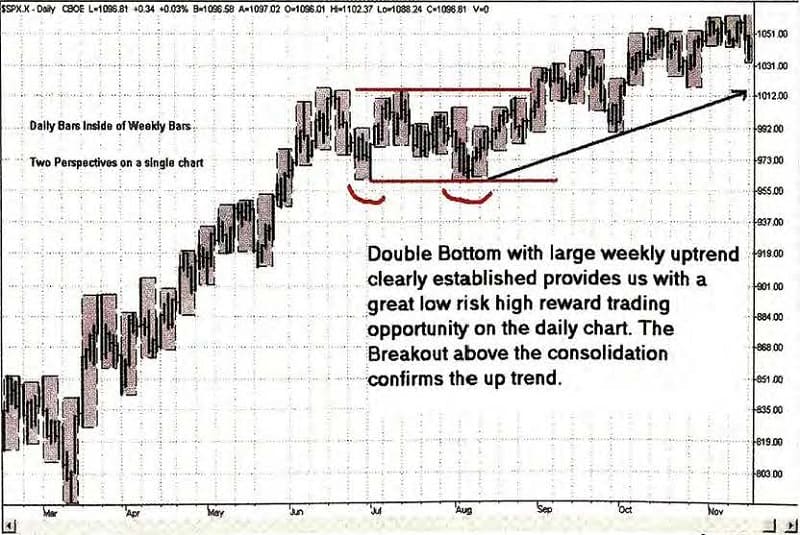
The primary usefulness of trend information is to prepare and develop entry and exit strategies for trading. If we are generally “bullish,” we wait for buying opportunities such as double or triple bottoms or a price retracement that finds support on our daily, weekly or monthly trend lines. If we are “bearish” and anticipate lower prices, we sell short at each double top or triple top as well as price retracements that find resistance on our daily, weekly or monthly trend lines. Bar grouping allows us to see more than one perspective of trend at a time. This type of chart also provides a much better feel for the market’s current level of price volatility. As a final example, I have drawn boxes around each weekly group of 4 so that we can see the daily inside the weekly and the weekly inside the monthly bars. This type of charting gives you a much different feel for the markets and their underlying trends.
Advanced Books and Courses on Price Action Trading


It is also very interesting to note how often bars of similar size and/or harmonic proportion develop in the markets. Typically, as the markets lose directional momentum, the size of the bars begin to compress and decay.
Therefore, there are two types of market trends that you can follow much more easily with this type of charting. (1) The directional trend of the price movement and (2) Volatility trends, which are based on the vertical size of the bars that result from grouping.
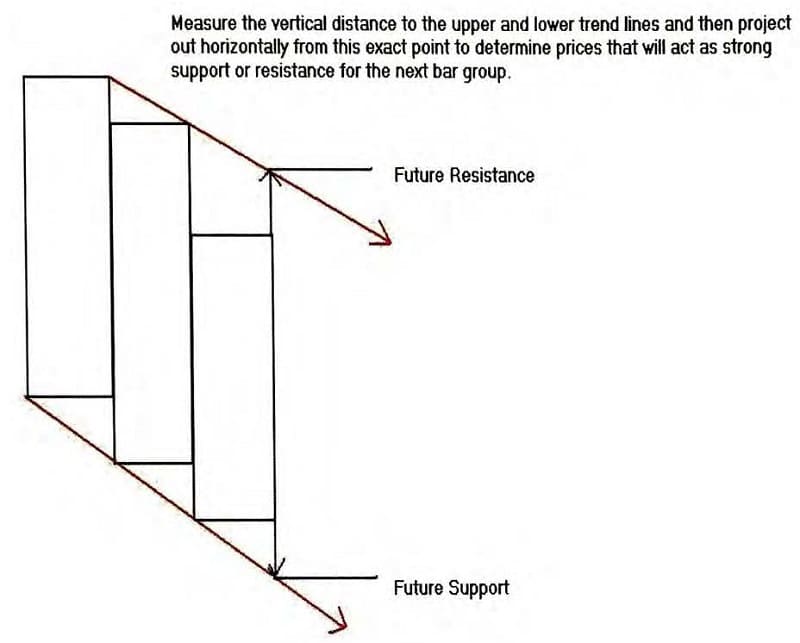
The next chart illustrates how to properly draw trend lines based on bar groups.
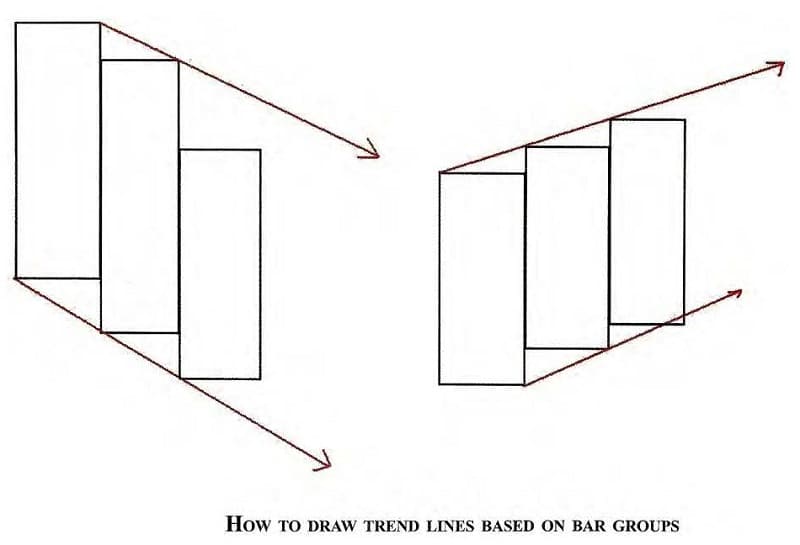
If you would just visualize each bar group as a simple rectangle, the following description along with the above illustration should make the procedure perfectly clear. For DOWN TRENDS, start at the upper right corner of the rectangle and connect the trend to other upper right hand corners of the future bar groups. Also, project the lower channel of the trend by starting in the lower left hand corner of the rectangle and connecting the trend to other lower left corners of the future bar groups.
For UP TRENDS , start at the lower right hand corner of the rectangle and connect the trend to other lower right hand corners of the future bar groups. In addition, project the upper channel by starting at the upper left hand corner of the rectangle and connecting the trend to other upper left corners of the future bar groups. The trends can only be projected from bar groups of the same time scale. For example, only connect weekly groups to other weekly groups or monthly groups to other monthly. Do not mix up the scales when drawing grouped trend lines. Often times, you can pin point near exact tops and bottoms where the particular market will meet with very strong support or resistance through the use of these trend lines.
You simply determine how “tall” the next bar would have to be in order to hit the upper and lower trend line and that will give you a specific price that will act as support or resistance for the next bar group. If you based your trend lines on weekly groups, then the numbers will be weekly support and resistance. If you base your trend lines on monthly groups, then the prices will be monthly support and resistance figures. The next chart illustrates the approach.