Trading Articles
Pythagorean Market Timing: The 1-3-5 Harmony Method
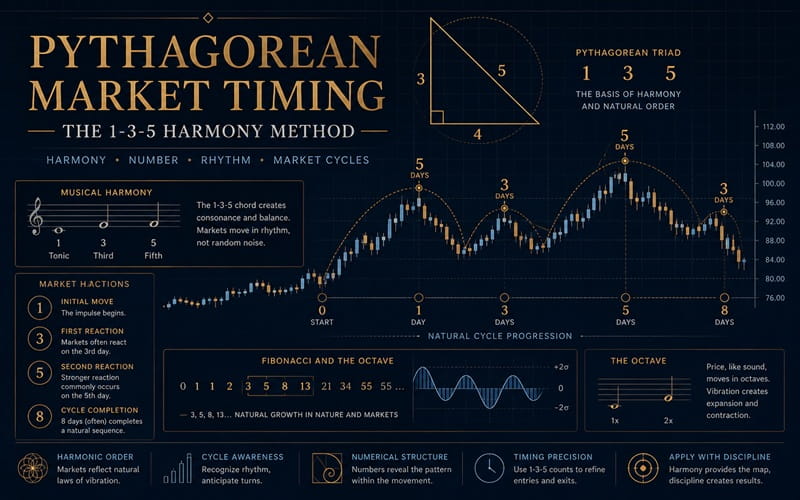
Pythagoras was born the son of a gem- engraver in Italy in 582 B.C. He died at 82. He started his arcane school at Cratona with these purposes; to study physical exercises, mathematics, music and religio-scientific laws. Do you know that he laid out the musical scale of vibrations per second? All musical instruments are tuned to this A, the 440 vibrations pitch. Do you know that 1/3/5 notes when played on the piano harmonize? You will find 1/3/5/8 notes (8 is an octave – m music it is written as 8va). The 8th note is C again, a start of a new 1/3/5, only an octave higher. This will make 1/3/5/8/10/12/15 notes all harmonize. This is called a major chord. Any two or more of these notes in this 7 note combination will be in harmony with each other.
This harmony also appears in the structure of commodities: The big problem is the method of counting. Below I have outlined a chart on May Bellies, 1992. As I mentioned before, the major chord in music is 1/3/5. Basically, the 1st note is #1, you do not count from the C note to the D note for a one count as the Elliott Wave count. The 1st note is #1, the 3rd note is #3. This is a major error in the day count that has many counters confused. When you count the days for what they are, (day 1 is #1 not 0 day) you will be surprised how well you can make 3rd and 5ths and 8ths of this in price days.
In reference to the charts in this article, if a number on the chart has a circle around it, it is denoted by a c after the number, for example SC. If the number has a square around it in this article it is denoted by an S after the number, for example 3S. The next problem is the double count. It is important in Symmetrics that we use the double count because the high day can be the 8th day up, but it also becomes a day #1 down. You will notice in the chart below, the up days starting with #1 are in square boxes as 1S, and the 85 day up becomes a 1C day down also. The down day counts are all in a circle 1C. In the May Pork Belly Chart (Fig #1), you will notice 34.11 was the low day 15, the 2S day was high at 36.05 and the 35 day was a 100 point correction or a 50% of the move from 15 to 35. In Symmetrics one rule is that if 35 day holds the 1S days bottom, the prices will go higher.
A 62% correction is a strong support and a 50% correction is stronger, this means higher prices are coming. The price advanced to 40.15 high on day 8S when the low of day 8S is broken, we start a down count, the day 8S now becomes a 1 C circle down day. In Symmetrics the up days are numbered on the bottom of the price day and coming down the day numbers are placed on the top, or above the days move. The price fell to 36.80, 36.92 was a 62% of the 34.17 low to the 40.15 high. Here we have two buy principles; this was a 62% correction and a 5 day time. When this SC down low is in place, it now becomes a 15 day for a rally as soon as 1S days high is bettered. You have a 15 3S 55 day rally to 38.80. This is a 62% rally from 40.15 high 85 day to the SC day low. Prices for the day settled at 38.75 because of a split close. Next day the price broke the low of the 3S day and you have a 1C day move down. At this writing 2/21/92, we are 2 days down. Watch day 3C and day SC for support and reversal.
Now let’s go to the May 1992 Wheat Charts. In my 38 RULE BOOK I have many charts that illustrate my rule of #38; called, “the rule can make you rich”. Copies are still available and I include one copy with every trading method I sell. Rule #38 states; in a strong bull market, you should buy on all 3 and 5 day reactions because the prices will rally until a blow-off top is made. In this article we have four charts on the 1992 May wheat which should bring out the power of the 5 day reactions to the bull market and these should have been buying opportunities to buy long and also if long to add to your long positions.
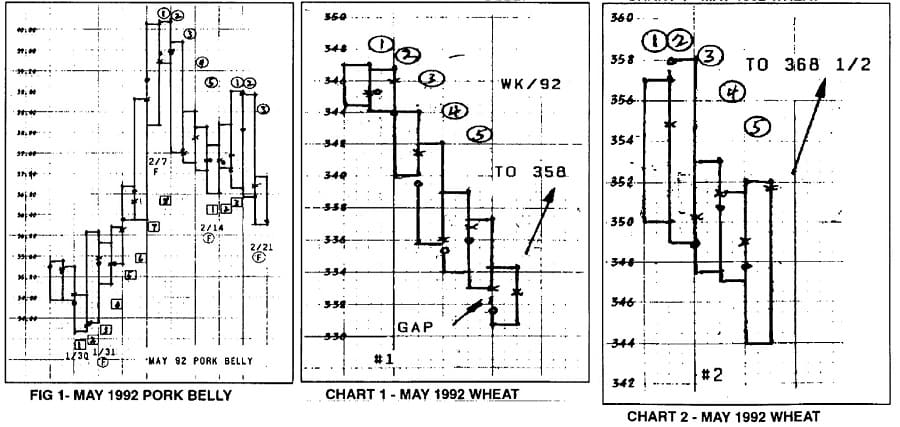
Chart #1 shows a 5 day down to 333. Day 6 opened at 3311/2, made low at 330 3/4 and rallied to 358.
Chart #2 shows the high close at 354 3/4, this is day 1C because it was the high close day.
Day #2 opened with a higher gap, but fell to break day 1, making it day 2C. Day SC made a low at 344 and rallied to 369 high.
Chart #3 shows 369 high as a #1 1C day and although day 3C and 4C rallied, day 4C ended making a new low. Day SC opened gap down and raffled to 386 1/4. Closing the gap on day SC was rule #33 in my rule book to buy. Here you have two buy rules again, one buy on closing of the gap on the 5th day, and buy on the 5th day reaction, with a close stop of course.
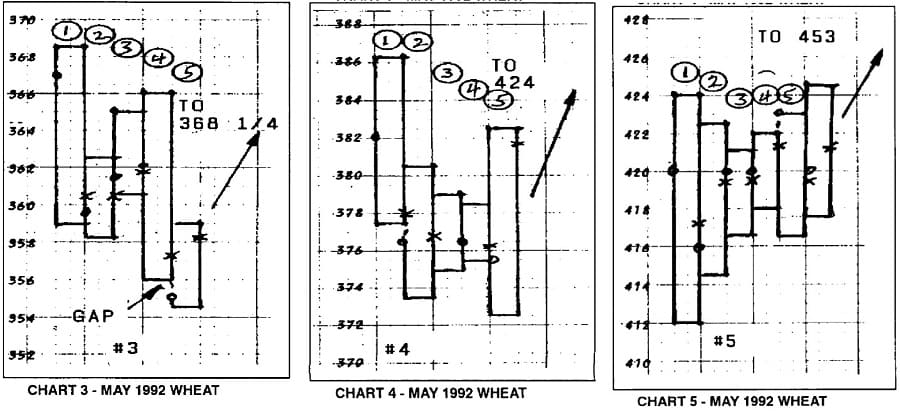
Chart #4 shows the 386 1/4 high, sold down to 373 1/2 on the second day. Days 3C and 4C were inside days and day SC made a new low at 372 1/2 and rallied to 382 1/2, that day. The rally went to the 424 high on 1/24 Friday, low was 412. The chart will show that a five day reaction was in effect, but all the days were inside days. All 5 days within the 412-424 range of Friday 1/24. This must surely be termed a strong market with this holding power. On the 6th day a new high was made and a fast rally started that climaxed at 453. When this price was made a fast limit down followed. This limit day down broke the uptrend, at least to this point. These are some dynamic examples of how the natural laws of the 3-5 can be of benefit to the short term trader: A tool to add to your tool box?
Advanced Books and Courses on Astro Trading & Esoteric Methods


In music there are 8 different notes. In the study of harmony (musical harmony, composing, arranging) we call the 1st note, the tonic or #1. The 3rd note is a 3rd and the 5th note is a 5th with the 8 note is an octave (8va). I mention this count method because it differs from the Elliott Wave count concept. I don’t believe Mr.. Elliott studies music or the Pythagorean theory,. Now to a step further with music as compared to commodities. In music there are 8 notes to a musical scale. You start with C and the 8th note up the keyboard is a C again, only this is an octave higher. I want to bring out a minor point here, but it is very important. All band instruments are tuned to the A note which is a 440 per second vibration. As I stated earlier, the 8th note higher is A again and you may be happy to know this A vibrates at 880 times per second, and the next 8va higher is double or 1760 vibrations per second… The lower 8va below the 440 A will vibrate at 1/2 the 440 or 220 times per second.
In music, songs are written in different keys. A song with two sharps ##, it will be in the key of D, and the song will end on the D note. Is it possible that we should look at the starting price of a contract to designate the projected ending price? This could be for further study some day. To get back to the note count, we have 8 notes, but there are 7 different notes: A-BC-D-E-F-G. After G comes A again, the eighth note. If you play a scale, you do not stop on the seventh note. The scale is not complete until you play the eighth note. Can this be compared to the market making a high and following a sell-off, goes up one more shot to make a new high and play that eighth note? Now the eighth note becomes a #1 again for the next octave (8va) higher scale, etc. With these 8 notes (white keys) there are 5 more notes, which are the black keys on the piano. We now have 8 white keys and 5 black keys. This is a total of 13, all Fibonacci numbers. Did Pythagoras come up with the number series 500 B.C., before Fibonacci? No matter from what note you start on the piano, there are 8 white and 5 black keys to any octave.
In music sharps and flats denote the key of that song. The key is governed by the number of sharps or flats. It is a firm law of harmony. You will not have a song with 3 sharps which will be in the key of A end up in any other note or chord but A. Can it be price structure? Think on that!
- Joe Rondinone taught music for 30 years. He taught at the Julius Hartt School of Music