Trading Articles
MACD-Suitable Stocks By Kevin Luo
Trading signals generated by the crossover of Gerald Appel’s moving average convergence/divergence and signal lines are popular and simple to use. Do they work for all stocks in all market conditions? Find out here. The moving average convergence/divergence (MACD) signal line crossover is a popular technical indicator used by many traders and investors. The MACD was developed by Gerald Appel in the 1960s and is readily found in trading platforms of all types. It generates trading signals upon crossovers of its MACD and signal lines. The method is considered simple to use; however, many have doubts about how effective the method is. To find out whether the technique works, I conducted a backtest on a large portfolio of stocks traded on the major exchanges. The results of the backtest will help determine the level of effectiveness of the MACD method.
Here’s What I Found
In the study, I selected approximately one third or 1,816 stocks traded on the NYSE and NASDAQ for the backtest. These stocks met the following selection criteria:
- Are common stock
- Trading at $2.00 or higher
- Had continuous historical daily data (date, open, high, low, and close) from January 1, 2005 to August 31, 2014
- Had no data errors, such as unadjusted price data from stock splits.
My objective in backtesting using this process was to produce test summary statistics from the simulated trades (long trades only) of a portfolio of stocks. The scale of the backtesting is sufficient to make a reasonable conclusion about the effectiveness of MACD. The parameter setting used is the default at 12/26/9 (12-day EMA, 26-day EMA for MACD line, and nine-day EMA of MACD for the signal line). This study employs the MACD signal line crossover method as the trading rules for the backtesting.
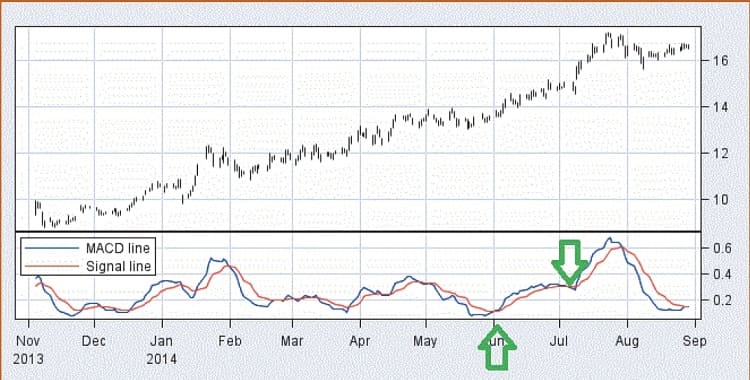
A buy takes place when an upward crossover occurs. A sell takes place when a downward crossover occurs. For calculation consistency and standardization, the close prices on the crossover days are used as the buy or sell price. For example, in Figure 1, the up arrow points to an upward crossover, while the down arrow points to a downward crossover, which is the crossover immediately after the upward crossover. The buy happens on the up arrow day and the sell occurs on the down arrow day. The close prices on these days are recorded as the entry and exit price, respectively. The difference between the exit price and the entry price is the simulated result computed in percentage terms. Using a custom-built stock analysis system, I ran the backtest and analyzed all trades in the 1,816 stocks.
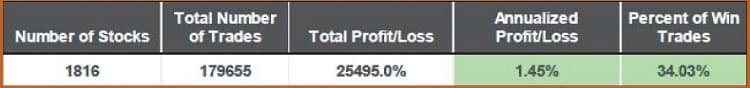
The summary of the backtesting results for the portfolio can be seen in the table in Figure 2. The value displayed in the fourth column of the table shows that from January 1, 2005 to August 31, 2014, for the 1,816 stocks, the annualized profit/loss was only 1.45%. I calculated this profit/loss figure based on an equal-weighted approach, that is, the same weight was assigned to each of the stocks in the portfolio regardless of stock prices. I used the following equation:
Annualized profit/loss = Total profit/loss
/ Number of stocks
/ Time period (or 9.7 years)
The results of this backtest showed that the MACD method did not produce a meaningful return. The finding suggests it is unlikely to make a profit over time on a portfolio of randomly selected stocks using only the MACD signal line crossover strategy.
Get Forex Profits With MACD Course By Frank Paul
The selected stock groups show significant improvements in profitability.
Why was the MACD signal line crossover method ineffective in the backtest? The methodology should not take the entire blame, because markets are not static. In fact, no study has proved that a technical method works on all stocks all the time. Trading a group of randomly selected stocks using the MACD or any other simple technique is unlikely to generate a meaningful profit over time.
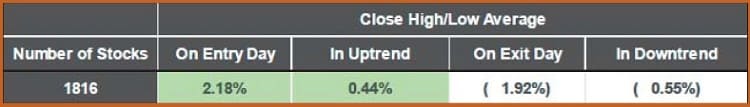
Methods are available to improve your results. One approach is to select suitable stocks. It’s an approach designed to make the MACD method more effective without revising the MACD setting or directly incorporating other technical indicators into the technique. How do you identify suitable stocks? One way is to connect to the root of the MACD. The MACD is considered a trending momentum indicator. In the table in Figure 3, the statistics from the backtesting process show that the crossover, or signal days, are the ones with the larger price movements. On the entry signal day, the average close high/low, expressed as close – close(yesterday) in percent, is 2.18% (column 2) compared to 0.44%(today%) (in column 3) on average for a typical uptrend day (I’ll discuss stock trends later). On the exit day, the average close high/low is -1.92% (column 4) compared to -0.55% (column 5) daily, on average, during a typical downtrend.
Stocks with greater trend range and number of uptrends are considered suitable for MACD trading and could be sought for further analysis.
What Does This Tell You?
This suggests that the MACD was developed with the intention to catch the uptrend movements by taking a long position when the upside momentum surges and exiting the position when the downside momentum moves in. If this assumption can be confirmed, it means the characteristics of an uptrend must be related to the trading performance of the MACD.
Mathematically, if the entry price remains the same, then the higher the exit price, the greater the profit. It is reasonable to assume that this price range from the entry to the exit is positively related to the stock trend range. The next step is to confirm the existence of such a relationship. To establish the connection, I need information on stock trends.
Suggested Books and Courses About Market Indicators


To understand the characteristics of a price trend, it is necessary to first isolate all stock trends from the raw datasets. In this study, there are two types of trends: An uptrend is recognized when the uptrend range is measured at or greater than 20%. A downtrend is recognized when the downtrend range is measured at 20% or greater.
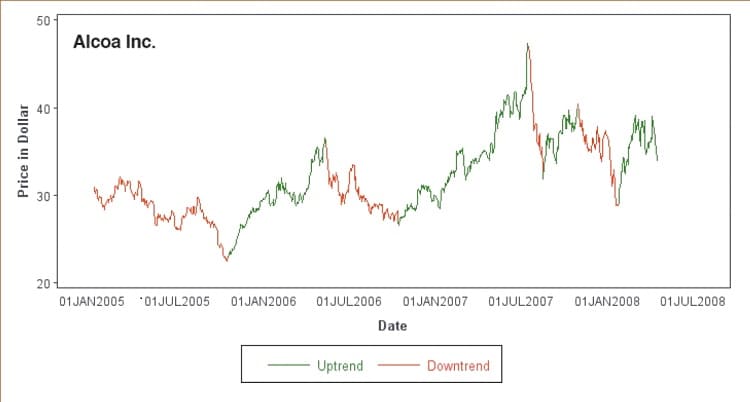
In Figure 4 you see the isolated trends for Alcoa Inc. (AA). The software, which was used in the backtesting, is capable of isolating the stock trends. After the trends of 1,816 stocks were isolated, the trend range traits can be summarized. The software outputs and exhibits the statistics of trend range and number of uptrends for the period that is being studied (see the table in Figure 5). The number of uptrends statistic (column 3) is considered as important as trend range. It refers to the trend count for a specific stock. If the trend ranges of a stock are suitable for MACD trading, then the higher values for the number of uptrends produce the greater profit. Therefore, stocks with greater trend range and number of uptrends are considered suitable for MACD trading and could be sought for further analysis. In order to pick out stocks fitting that description from the 1,816 stocks, each stock was ranked according to uptrend range and number of uptrends. The higher rank is given to the stocks with the greater trend range and number of uptrends combination (column 4). The rank number is merely for sorting stocks.
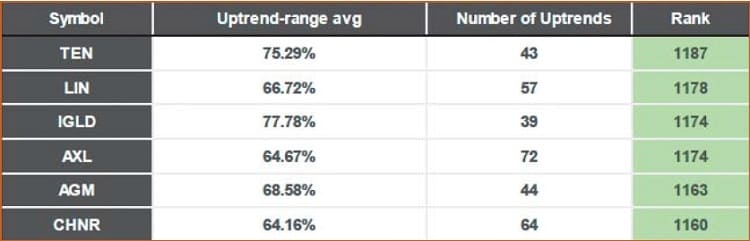
I used three groups of stocks. Group 1 contains the top-25 ranked stocks. Group 2 holds 25 stocks ranked from 26 to 50. Group 3 includes 25 stocks ranked from 51 to 75. The stocks are mutually exclusive but are considered to be the more suitable stocks for the MACD signal line crossover method. The expectation is that group 1 outperforms group 2, and group 2 outperforms group 3 in the backtesting because of the rank levels. After the software implemented the tasks of reorganizing and summarizing the backtesting results according to the three groups, it resulted in the statistics you see in the table in Figure 6.
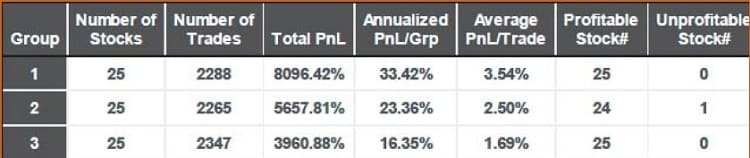
Comparing these results with the initial backtesting results, it is clear that the selected stock groups show significant improvements in profitability (column 5) over the 1.45% profit generated from the random portfolio of 1,818 stocks (Figure 2). If you look at the average profit & loss per trade in column 6, you’ll see that group 1 has the highest return, followed by group 2, then group 3. This indicates a positive relationship between the ranking and MACD profit. There was only one unprofitable stock in group 2. All other stocks generated profits in the backtests (columns 7–8).
It Works
A given technical indicator is popular for a reason: It works when it is properly used. By understanding of basics of the MACD signal line crossover method, I have established, through this study, that there is a positive relationship between the method and traits of a stock trend, trend range, and number of uptrends. The successful confirmation of the relationship in turn helps to find suitable stocks that can be used for MACD backtesting. This approach translates to a significant improvement in the effectiveness of the crossover method. More important, it is easy to implement.
Kevin Luo is an independent technical analysis researcher who focuses on automated price trend–related analysis and generation of trading strategies. He and his project partners have developed an automated trend analysis and backtesting system for high and low-frequency trading. He may be reached via email at [email protected].