Trading Articles
Less Stress With The JM Internal Band By Koos van der Merwe
Here’s a trading strategy that helps you sleep soundly and prepares you for the market the following morning. Throughout my investing career, I have always believed in simplicity. I have studied Elliott wave theory and used it to give me an idea of which way the market is heading. I have used and still use WD Gann to get an idea of when a major or minor reversal will occur — timing the market. Knowing when the market will turn up or down is a major advantage to my investing strategy, since the first lesson of investing is Never go against the overall trend. To be a buyer in a collapsing market is playing with fire, and selling short in a rising market is just as bad, unless you have information that no one else has.
RUN WITH THE TREND
Knowing what stock to buy or sell short is definitely an advantage, especially when you have identified a market bottom. But you must ask yourself: Do you want to be a bottom picker? Do you want to look at a chart with a band, whether Bollinger, Donchian or, for that matter, any other band, and place a buy order at the bottom of the band as long as it coincides with your favorite indicator’s buy signal? Or if you like placing shorts, would you place a sell short signal if you thought that the share was overbought as it reached the upper band, with your favorite indicator suggesting a sell signal?
This has always worried me. Do you buy into a falling market and sell short into a rising market, or do you wait for the market to turn and go with the trend? The standard advice has always been “Run with the trend,” a favorite with analysts. The problem that regularly surfaces for a novice investor is, “When do you close a position?”
I have always preferred going long in a rising market rather than bottom picking, and definitely playing short in a falling market rather than guessing a top. I hate waking up in the middle of the night worrying about my trades. Over the years I have found that by using the JM strategy, I sleep soundly and have a clear mind ready for the market the following morning.
Figures 1 and 2 should give you an idea of what I am referring to when I write “Buy/short with the trend.” Would you prefer buying at BUY 1 or at BUY 2? In both instances you are buying at the same price. The difference is that at BUY 1 you are buying in a falling market, and at BUY 2 you are buying in a rising market.
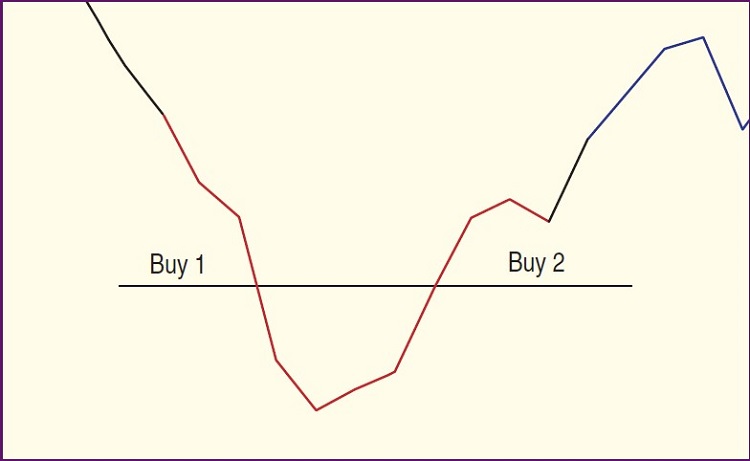
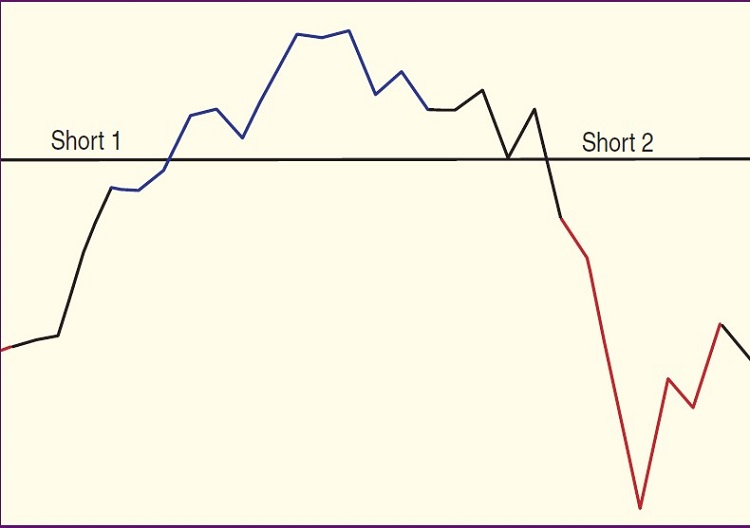
The same applies to shorting the stock. Would you short the stock at SHORT 1 as shown in Figure 2 or at SHORT 2? I would prefer buying at BUY 2 and shorting at SHORT 2. In both instances I am trading with the trend in the market and not looking to estimate where the stock will be by bottom picking or top shorting. So what strategy would I use to buy or short with the trend?
THE INTERNAL BAND STRATEGY
The strategy I use was given to me by a lady many years ago who remarked, “This strategy has been very kind to me.” For a long-term buy & hold (I am not a regular short seller), I have never found a better strategy. I call it the “JM internal band strategy” (“JM” being the initials of the lady) and it works like this:
Draw a 15-period simple moving average (SMA) of a stock and offset it upward by 2% and downward by -2%. You take a long position when the close breaks above the upper band and a short position when it breaks below the lower band. You can use the break above (below) the 15-period SMA as a sell (buy) stop if you are long (or short), or you can also determine an exit strategy or stop that you are comfortable with.
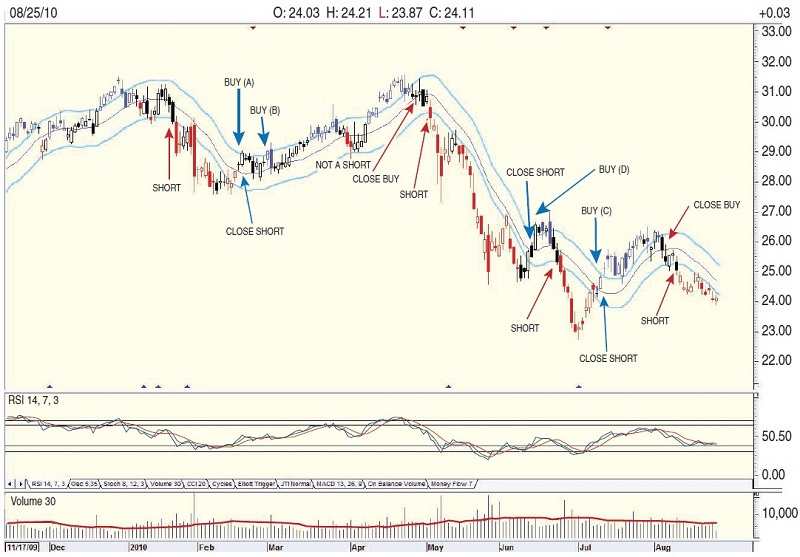
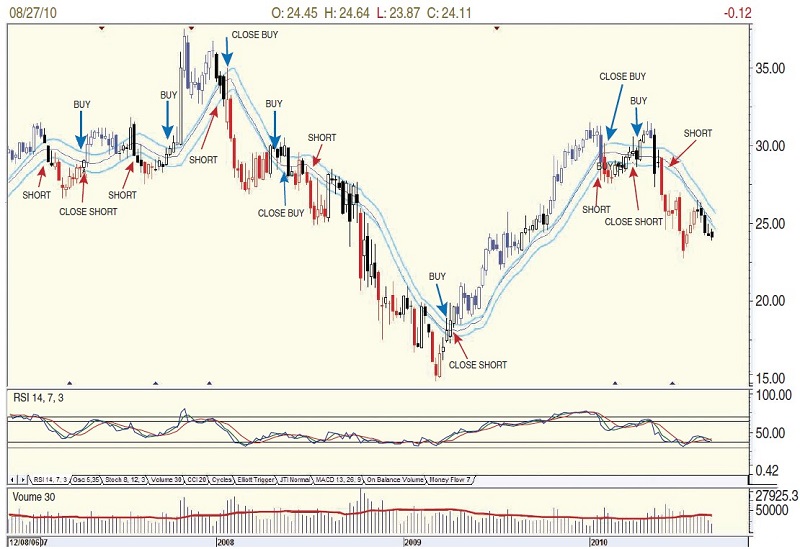
In the daily chart of Microsoft (MSFT) in Figure 3, I am showing a bar chart of MSFT with a JM band in light blue. Note the buy and short signals on the chart. Note too that Buy(A) was a buy signal because the closing price was above the JM upper band. If you missed that buy signal, you had the opportunity of buying at Buy(B). Whether going long or short, I used the 15-period SMA as a stop.
Eyeballing the chart, the only bad buy would have been Buy(D). But in today’s market, all the shorts have been extremely profitable. Note the use of the relative strength index (RSI) as a confirming indicator.
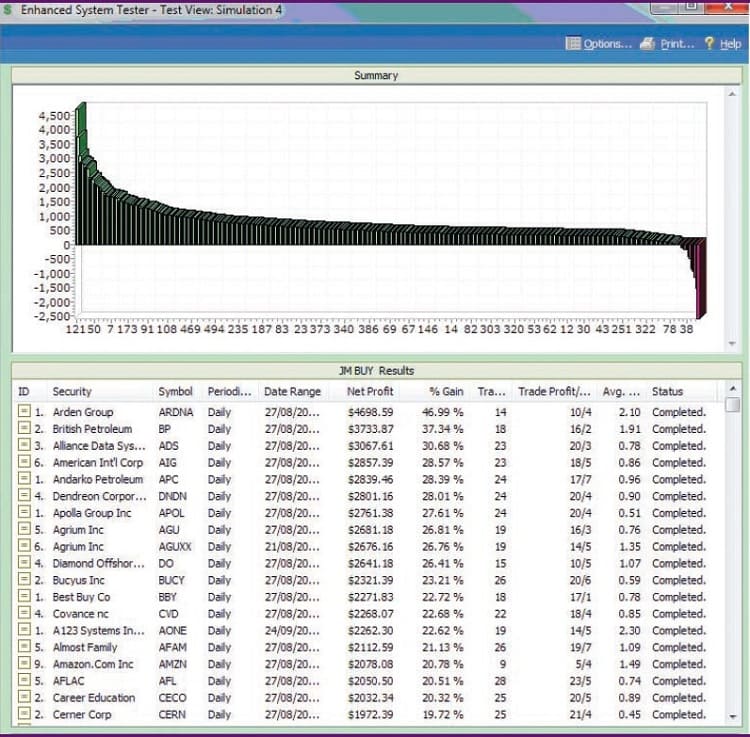
For those who are long-term investors, a weekly chart with the JM internal band can be seen in Figure 4. Combined with the RSI, the strategy is far more beneficial. To test the profitability of the strategy, I turned to MetaStock Enhanced System Tester. If you look at the results displayed in Figure 5, the top profitable stock was the Arden Group (ARDNA) with a 46.99% gain. Some shares showed losses but far less than those that were profitable, with the worst loss being Salesforce (CRM) at -25.88%.
Suggested Books and Courses About Market Indicators

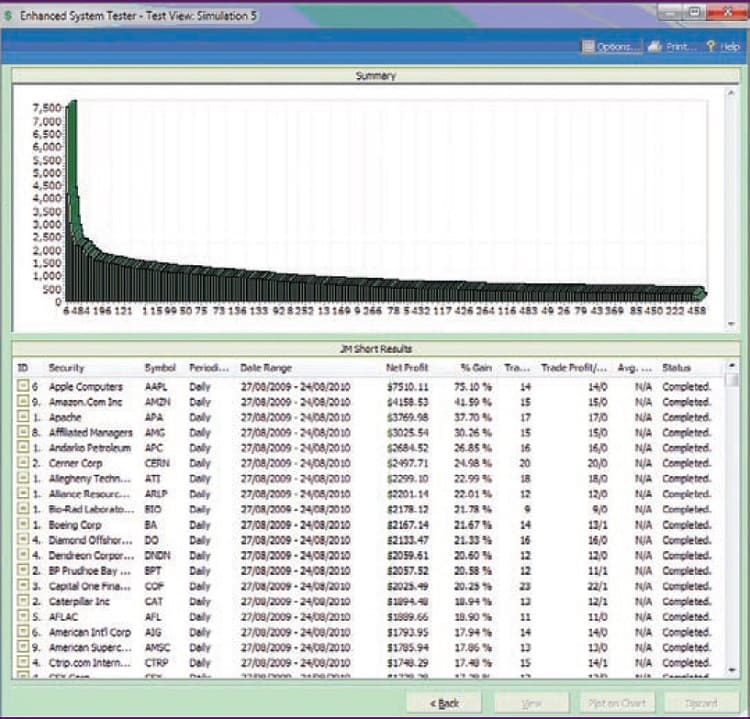
For short signals (Figure 6) there was not one negative result, with Apple Inc. (AAPL) remarkably giving a 75.10% return. (Apple a profitable short? We forget that since June 21, 2010, till the end of the test period — that is, August 24, 2010 — AAPL shares have fallen from $279.01 to $242.01.) The MetaStock formulas for the Enhanced System Tester are shown in the sidebar, “MetaStock Formulas For Enhanced System Tester.”
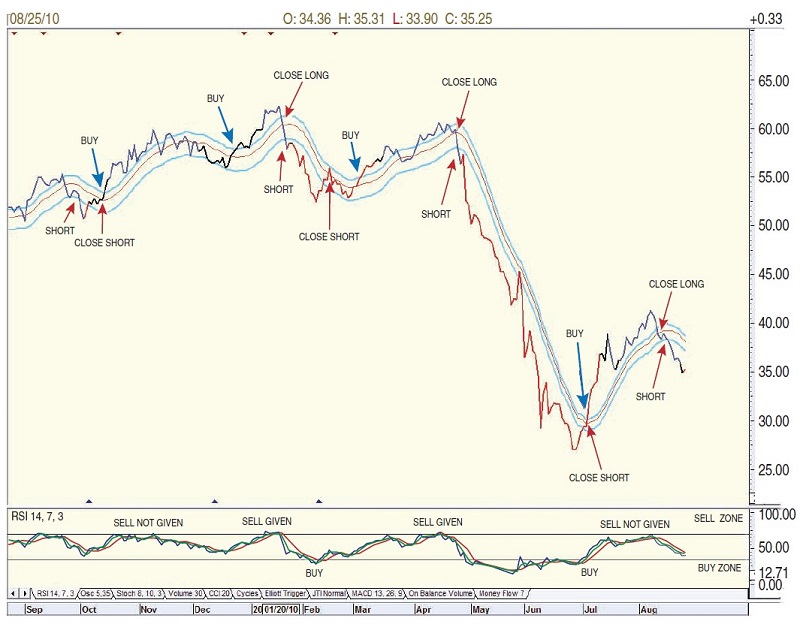
Let us look at Figure 7. This one is of a company, BP, that has had its share of news headlines. In the chart I have drawn the price as a line rather than a candlestick because it is easier to read when prices penetrate the JM internal band. I have included the RSI. Note that in August 2010 the RSI did not move into the sell zone, yet the JM internal band suggested a short that is proving to be profitable. Whether you use a candlestick chart or a line chart depends on your ability to read a signal correctly.
The only time the strategy has let me down, and we can see this by studying the charts, is when the market is in a sideways trend, a problem that occurs with any strategy that uses a moving average. We can never forecast this, so you buy or short as indicated. Staying with the strategy over this period has minimized losses, even given small profits.
KEEPING IT SIMPLE
Conservative investors could well use this strategy to monitor their portfolios, to when a position needs to be closed or confirm a long or short position on any share they wish to play. If you only play the long side of the market, you could change the offset to 1.5% for a long position, for example, which would give a buy signal much faster, but then you are increasing the risk.
Study the strategy and decide on your risk potential, especially the 3 am wake-up call — and ask yourself, do you want to sleep stress-free or not? The JM internal band strategy will help you with a good night’s rest.
Koos van der Merwe has been a technician since 1969 and has worked as a futures trader and finally as a technical analyst with a stock brokerage firm in Johannesburg, South Africa. Currently, he acts as a consultant for a fee of $1, a charge he believes is necessary beacause free advice usually does not carry much weight.