Trading Articles
Gann and Fibonacci Price Analysis for Gold Trading
Professional speculation has three main components for every trade – to enter, hold and exit. The most challenging part of any market is projecting important highs and lows before they happen. This has also been referred to as goal or objective trading. Two of the most famous methods of price projection in use today were developed and advanced by W. D. Gann and R. N. Elliott. In following, Gann’s Cardinal Square and Elliott’s use of Fibonacci Progressions rather than just give a recommendation without explanation. These are just two of the many systems developed and used by Gann and Elliott. Further Gann and Elliott approaches are presented in my book, Analytical Methods for Successful Speculation.
R. N. Elliott was a bookkeeper who has a fascination for mathematical price series. He constantly developed different number progressions, high-low price cycles, but most of all, price cycle contraction and expansion series. His most famous progression series is the Fibonacci Progression, named after the Italian, Leonardo of Pisa (Leonardus Pisanus (Latin) or simply Fibonacci). First published in 1202 A.D. as the Liber Abaci and later in 1220 A.D. in Practica Geometria, Fibonacci showed this mathematical progression using an involute process. (I.e. 1+1 = 2; 2+2 = 3; 2+3 = 5; 3±5 = 8; etc.) Using any number in the series as a multiplier or divisor, a ratio evolves of 1.618 or 0.6 18 or its inverse 0.382. This ratio is observable in numerous natural phenomena; the branching of trees, sea shells, spirals (i.e. the nautilus) sunflower seed growth, the human inner ear, etc.
For any market a significant primary high or low price must best used. Due to gold’s previously controlled prices of $19.39 for 45 years, $20.67 for 97 years and finally $35.00 before deregulated in 1971, gold gives a good example of a significant low to work with.
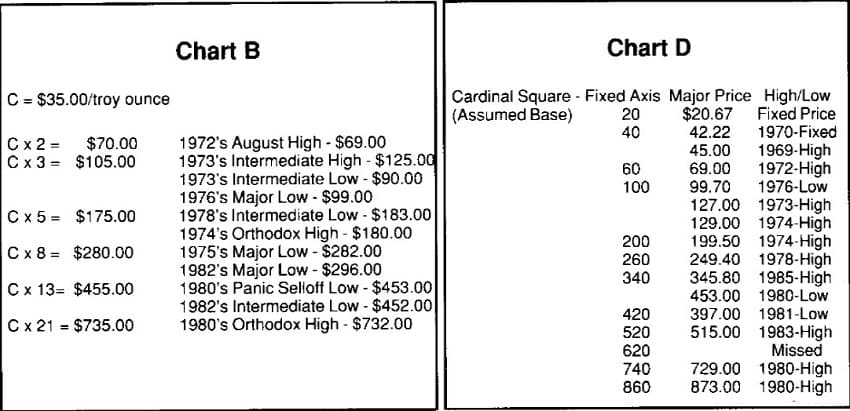
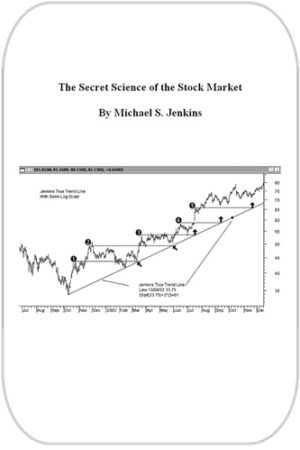
When Fibonacci Progression is applied to gold using the $35.00 low, we have2x$35=$70; 3 x $35.00=$105; 5 X $35 = $175; 8 x $35 = $280; etc. An analysis of these prices is demonstrated in the copy of “Chart B, Fibonacci Price Analysis”, page 145 from Analytical Methods for Successful Speculation. Fibonacci Price Progression shows future meaningful highs will probably be $1,190.00 (34 x $35); $1,925 (55 x $35); or $3,115 (89 x $35). When or how these prices may be achieved requires an in-depth study of current financial data and their correlation to gold’s price fluctuations.
Advanced Books and Courses on W.D. Gann Methods
The most famous and least understood market mathematician was W. D. Gann. Gann passed away in 1955 with a net worth of over $50,000,000 acquired from the markets. More astonishingly he was charging $5,000 (1955 dollars) for his market course, containing most, but probably not all, of his trading methods and secrets. That trading course cost was roughly half the value of a three bedroom home in 1955.
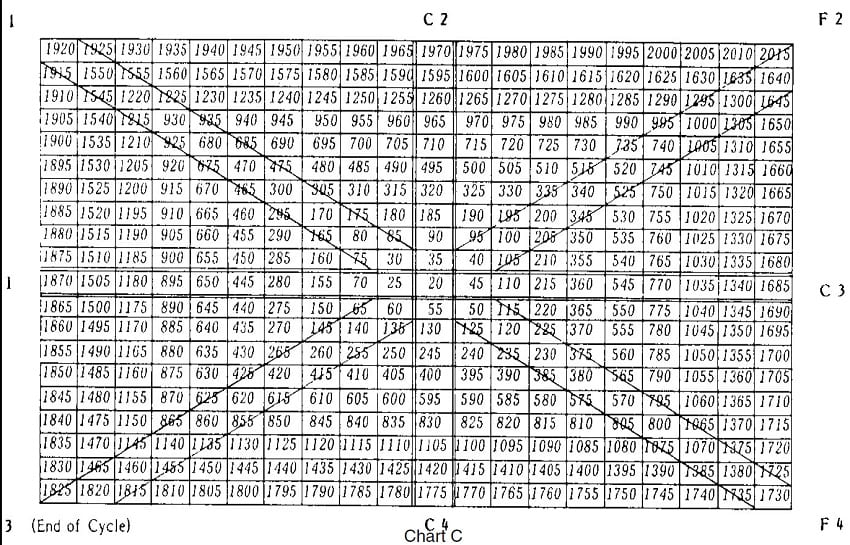
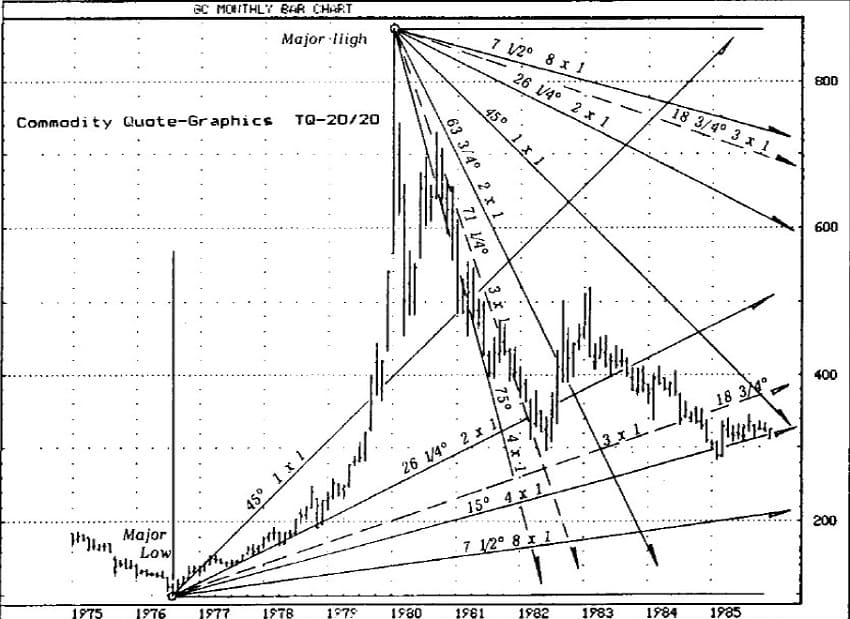
Prior to gold’s price being pegged at $35.00, it was first pegged at $19.39 and then $20.67, as mentioned above. Using a base price of $20.00 (which is a mean of $19.39 and $20.67) and by increasing increments of $5.00 Gann’s Cardinal Square displays and apparently meaningful series as shown in “Chart C, W. D. Gann Cardinal Square Chart.” To test which of the four axis worked best, a comparison grid is shown in “Chart D, W. D. Gann Cardinal Square Prices”. Actual price highs and lows are shown to the cardinal square axis F2-F3 numbers.
Due to the many variances, it would appear that Gann’s Cardinal Square is not as accurate in predicting significant highs and lows as Fibonacci Progression. I feel Gann’s systems were more applicable in his lifetime due to the prominence of grains. There were virtually no precious metal, financial, or stock index futures with which to do price series analysis at that time. Perhaps if gold’s price has never been regulated by the U.S. Government, Gann’s Cardinal Square and Fibonacci Progression may have been more accurate in future price predictions. However, since many invariable needs to regulate his environment, natural time/price sequences don’t always work as well. Just look at the October 1987 stock market. Then again, Kondratieff’s 52 year cycle of economic contraction may have begun in that market. The most challenging part of speculation is exiting profitably at a predetermined major price objective. By hindsight, both methods presented some viability in these examples.
Good read, yes metals are under “lock & key” your spot on with the intervention angle. Thank you for the good read.
Hope you enjoy it!