Trading Articles
Gold And The New Technical Triad By Gary S. Wagner

Forecast gold prices by combining Elliott wave, Fibonacci, and candlesticks. Most market analysts will agree that supply and demand economics are a major influence on the current price of a commodity. It is, however, market sentiment that determines the perceived future price. If you can understand and quantify market psychology or market sentiment, you can more effectively forecast price. This has been the underlying assumption of Elliott wave and Fibonacci retracement theories.
ELLIOTT, FIBONACCI, AND CANDLESTICKS
To the market technician, Elliott wave and Fibonacci retracement theories go together like peas and carrots. Elliott wave incorporates many aspects of the Fibonacci sequence and retracement theory. It uses different retracement levels as benchmarks that certain waves should use. When R.N. Elliott devised his wave concept, he was not familiar with Fibonacci theory and only made this correlation later on. Then there’s a third ingredient that could be added to the mix: candlestick patterns. Adding this technique in combination with both wave and retracement theories can deliver greater market insight.
These techniques are all based on the assumption that market behavior is based upon the laws of nature and market psychology. These natural cycles can be identified and quantified to use in market forecasting. All three techniques, although different, have identified a specific and mathematically definable set of rules and guidelines.
Elliott wave, Fibonacci retracement, and candlesticks are all descriptions of how markets might perform. They are all able to define market sentiment or psychology in mathematical terms. By combining these three techniques, the synergistic effect is a more reliable and effective process for price forecasting. As of this writing, gold is trading at $1,230, which at this time is a record high. The price of gold has moved in a predictable manner, if you know the right roadmaps to follow. Let’s apply the Elliott wave count.
According to Elliott wave theory, a market trend follows a cycle, which is made up of eight waves. This eight-wave sequence will repeat until the trend is exhausted. This trend structure is composed of eight waves, divided into two phases: the motive phase and corrective phase. The motive phase is composed of five waves (waves 1 through 5). Waves 1, 3, and 5 will move in the prominent direction of the trend. These three waves are called the motive waves. They are separated by two retracement or corrective waves (waves 2 and 4), where the price action will move against the current trend. The corrective phase is composed of three waves (A, B, and C), which move opposite to the primary trend. Waves A and C will be corrective waves, while the B wave will move in the direction of the primary trend.
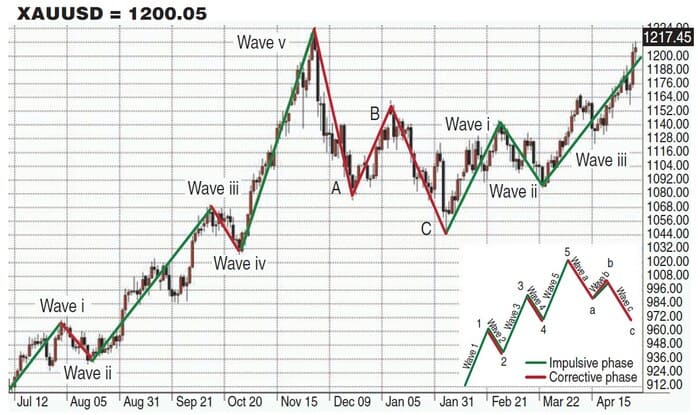
Figure 1 is a daily candlestick chart of forex gold (US/UAX) in which the Elliott wave count has been added. The motive phase drove gold to a new historical high of $1,221 in December 2009. The corrective phase in forex gold lasted from December 2009 to February 2010. With this top in place, I calculated the Fibonacci retracement levels. I used the low created just before gold broke $1,000, which was at $980 per ounce, and the high at $1,221. During the corrective phase, the market will give back a percentage of its gains. It will not be until the completion of the full wave count at the C wave that gold will find a bottom and begin the wave count all over again. By the completion of this corrective phase, gold had given up almost 78% of its gains, closing at just $1,040 per ounce.
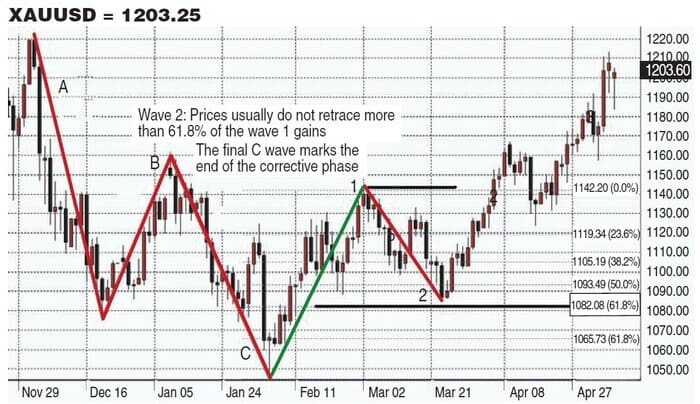
After the completion of the eight waves, the cycle is completed and the count begins again. Once again, the gold market enters the motive phase. This is the phase we are currently in. The first wave (1) occurred on February 2, 2010, as seen in Figure 2. From a low of $1,040 per ounce, gold climbed $100 higher to more than $1,140. Gold prices moved from the 78% retracement level to above the 38% retracement level on this single wave.
Suggested Books and Courses About Elliott Waves Method
This signaled the first corrective wave (2). There are specific rules for the wave count. Corrective wave 2 should not retrace more than 61.8% of the gains achieved in wave 1. Wave 2, which took just under three weeks to complete, did in fact trade right to that Fibonacci retracement level.
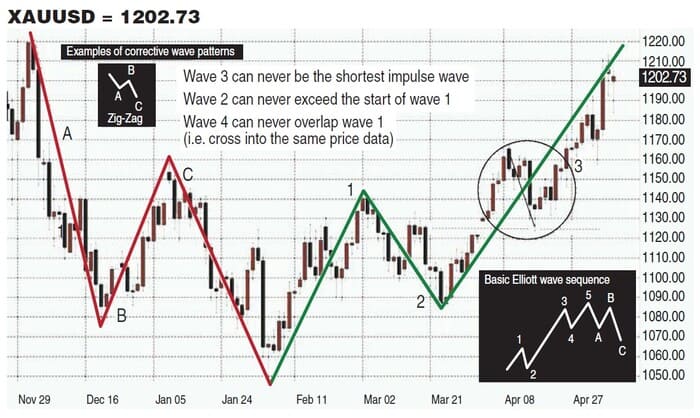
To the untrained eye, some might consider the wave count to be subjective, with room for interpretation. Because of the complexities in which markets behave, there are many variations to the basic wave pattern. However, all wave patterns must follow the three major rules that R.N. Elliott identified. There’s no flexibility in these three rules, so they must be followed exactly. Figure 3 illustrates the basic example of the wave count with all three rules in place. Because rule 3 states that wave 4 can never overlap wave 1, you have a clear indication that the current wave 3 has not ended.
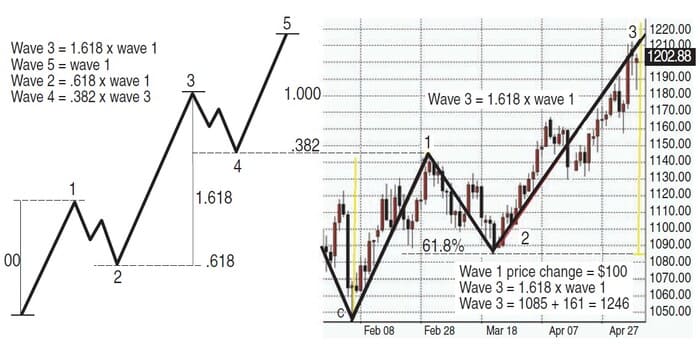
Figure 4 is a daily chart of forex gold starting at wave 1 after the completion of the eight-wave count. On this chart, you see the Fibonacci rules needed for a correct wave count. According to this count, we are currently in wave 3. If this wave count holds true, we could see the full wave not completed until it reaches 1.618 times the size of wave 1. This could take the market as high as $1,246. We should experience a corrective wave (wave 4) after the completion of wave 3; this correction should retrace roughly 38% of the gains in wave 3. This will be followed by one more motive wave (5) to complete the motive phase. Wave 5 should take gold to a new record high price, moving a length equal to wave 1.
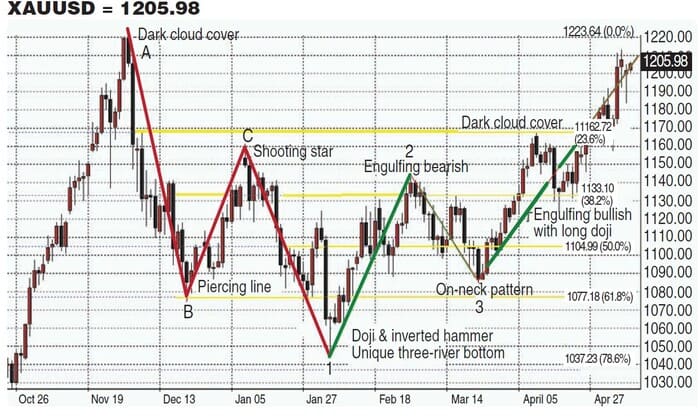
Figure 5 examines all three components of this technical triad: Elliott waves, Fibonacci retracements, and candlestick patterns. You can create a triple filtering system at points where all three indicators are in confluence. In Figure 5, the first corrective phase’s wave (A) trades to a low of $1,077, the 61% Fibonacci retracement point. A piercing line pattern forms and signals a bullish reversal. Wave B trades higher, finding resistance just below the 23% Fibonacci resistance level.
Suggested Books and Courses About Trading With Fibonacci


A shooting star candle marks the top. This marks the end of wave B. The C wave, which is the last of the corrective phase, breaks below the 61% retracement point and just before it reaches the 78% retracement point, multiple candlesticks, and a rare candle pattern known as the unique three-river bottom form.

Two reversal candles, the doji and inverted hammer, are part of the unique three-river bottom. This signals the end of the corrective phase, and a new wave count begins again. An engulfing bearish pattern signals the end of wave 1, just as the on-neck candlestick pattern signals a bullish reversal and the end of wave 2. Figure 6, “Calculating with Elliott wave projections,” shows the end result.
THE TRIAD
Candlesticks have an uncanny ability to reveal and identify key reversal points. However, filtering these signals with other market information is a critical component for success. Where a pattern is found within the trend determines the strength or weakness of that signal. Looking at all three methods at once gives you a comprehensive analysis of the market. By combining these three methods, you can produce greater insight than using any of these techniques by themselves. They complement each other and form a more synergistic approach to market forecasting.
Gary S. Wagner has been a technical market analyst for 25 years and is the coauthor of Trading Applications Of Japanese Candlestick Charting. He produces a daily video newsletter, “The Forex Gold Forecast,” for WFGForex website.