Trading Articles
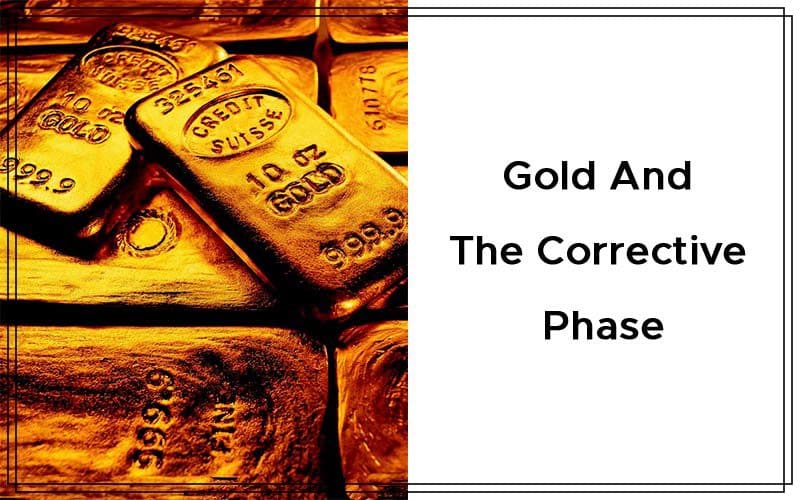
Gold And The Corrective Phase By Gary S. Wagner
Part 1 of this series discussed using Elliott wave, Fibonacci retracement, and candlestick patterns for analyzing the gold market. Part 2 examines the corrective phase that gold has now entered in this bullish gold run. Trading the gold market might look easy when you consider that it has gone up $242 in one year. One year! However, anyone involved in gold trading, whether it is through COMEX, forex, or exchange traded funds (ETFs), will tell you differently. Follow me as I track the final impulse wave into the current (as of July 21, 2010) corrective phase. Gold was nearing the top of wave 3 about mid-May 2010. Since then, we have completed that wave, ending with a new high of $1,248, only to end up as a footnote as a new all-time high of $1,265 ended wave 5.
ELLIOTT WAVES
Fundamentally bullish on gold, I think that gold by the first or second quarter of 2011 will take out the new historical high of $1,265 and possibly test $1,300. But before we get there, the yellow metal will need to go through a corrective phase. As outlined in Elliott wave theory, this correction would consist of three waves — A, B, and C: waves A and C the corrective (bearish) waves and the B wave a predominantly bullish wave.
Figure 1 is a daily chart of forex gold. Starting on the far left, you can see the first correction after gold hit a historical high of $1,221 in December 2009. According to Elliott wave theory, a market trend follows a cycle. That cycle is made up of eight waves. This eight-wave sequence will repeat until the trend is exhausted. This trend structure is composed of eight waves, divided into two phases: the impulse (motive) phase and the corrective phase. The corrective phase is composed of A, B, and C waves. They will move opposite to the primary trend. Waves A and C will be corrective waves, while the B wave will move in the direction of the primary trend. Here we see the corrective phase, wave C, which took gold to a low of $1,045 in February 2010.
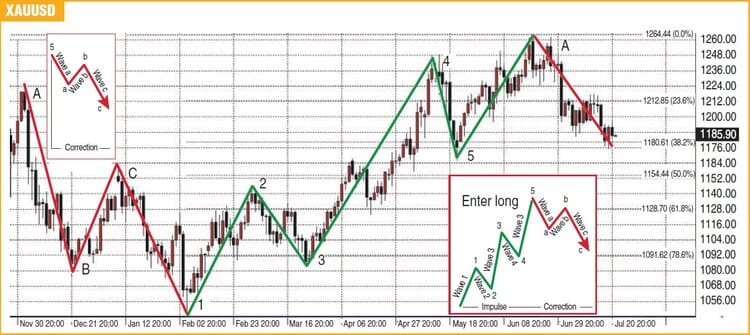
Now that the full eight waves are complete, gold once again begins its motive phase and another bull run in gold. This phase is composed of five waves (waves 1 through 5). Waves 1, 3, and 5 will move in the prominent direction of the trend. These three waves are called the “motive” waves. They will be separated by two retracement or corrective waves (waves 2 and 4), where the price action will move against the current trend. From February 2010 until the end of June 2010, we witnessed an extraordinary bull move in gold, taking it to a new historical high of $1,265. This high would prove to be the top in gold, as from there it traded lower, falling under $1,200. This began a corrective phase and the start of corrective wave A.
Figure 2 looks at the Elliott wave count as a price forecasting technique. I use wave 1 as a benchmark to forecast targets for impulse waves 3 and 5 and use Fibonacci retracements for forecasting corrective waves 2 and 4. Using wave 1 as a benchmark and applying the rules of Elliott wave amplitude forecasting has proven to be an accurate barometer in predicting the tops of both wave 3 and wave 5.
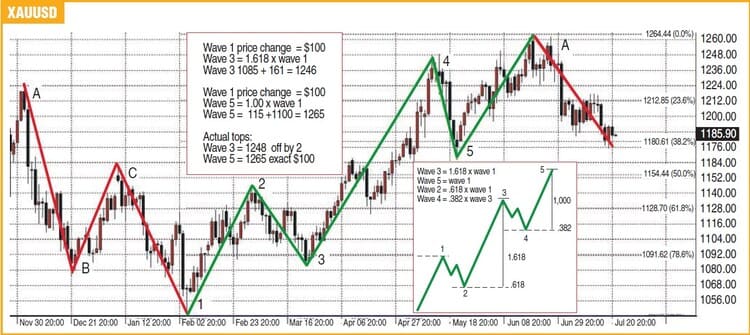
In mid-May 2010 when I wrote the first part of this article, I was looking for a top to wave 3 at $1,246. This was based on a projection from wave 1. The calculation was to take the price move of wave 1, which was $100 and then multiply it by 1.61 to equal $161. Adding $161 to the start of wave 3 (1085) resulted in a target of $1,246. Elliott wave projections were able to come within a few dollars of the actual top of $1,248. By applying these rules to the fifth wave, it proved to be just as accurate as in wave 3. From guidelines set forth by Elliott Wave International, wave 5 can be about equal to wave 1. So adding $100 to the low or start of wave 5 (1164) gives us a target of $1,265.
Figure 3 takes us to the July 2010 time line. A corrective phase could last any length of time, but if it is similar to the last correction we had, it could last two or three months. The last corrective phase stretched from December 2009 to the beginning of February 2010. If history repeats itself, this corrective phase might take us to September or October 2010.
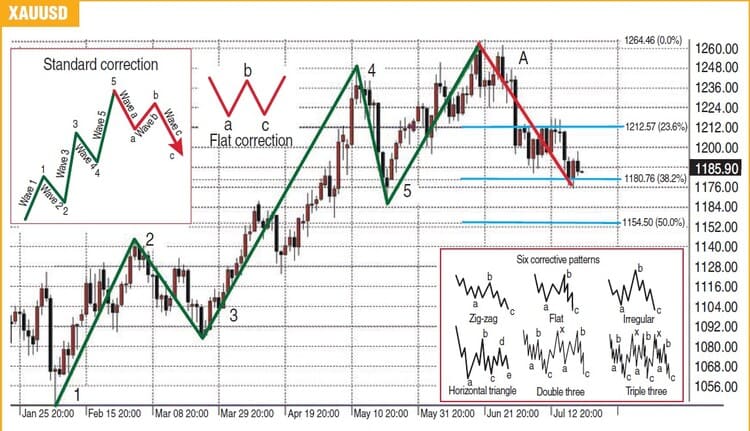
A corrective phase can be categorized into six different types of patterns, but two of them are more common occurrences. These are the standard zigzag and the flat corrections. Here, I will look at the possibility of either a standard zigzag or a flat correction to emerge. In a corrective phase certain rules also exist, just as in the impulse phase. Wave B, for example, cannot trade with a higher high than the fifth wave ($1,265). In fact, wave B should be about 50% to 75% of the move seen in corrective wave A.
Suggested Books and Courses About Elliott Waves Method
ADDING FIBONACCI RETRACEMENTS
RETRACEMENTS Figure 4 is a daily chart of forex gold looking at what a flat correction might look like. In a flat correction, the low of both the A and C waves are about equal. It forms a W-like shape. To calculate the possible targets for waves A, B, and C, you could use standard trend analysis or Fibonacci retracement theory, which is what I use. I have found Fibonacci retracement theory to match standard trendlines very well, and easier to plot. To create a Fibonacci number set for the corrective phase, I used the high of wave 5 and the low of wave 1.
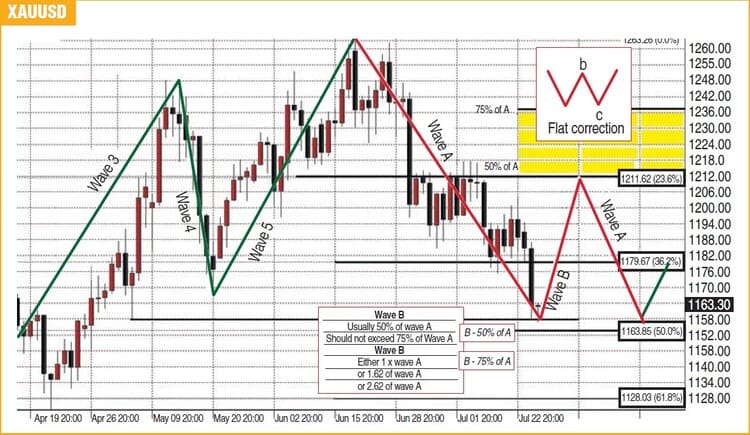
If this support level does not hold, $1,154 would be the next logical support level for gold. If $1,180, the 38% retracement of wave 1 to wave 5, turns out to be the bottom of the first corrective A wave, then in a flat correction the B wave could go to either $1,221 or as high $1,241 before we see the final C corrective wave. At the Fibonacci retracement levels, I look for candlestick patterns for confirmation of a top and bottom of that wave.
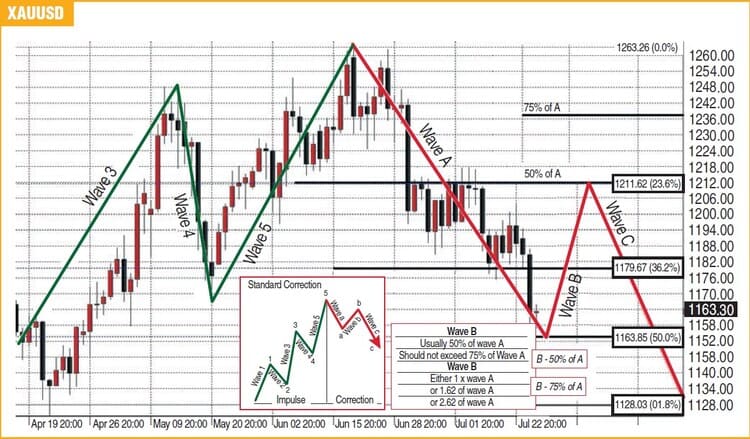
Figure 5 is a daily chart of forex gold projecting what a zigzag correction might look like if we had entered a standard corrective phase. In such a scenario, if $1,180 proves to be the support level for corrective wave A, then Figure 5 shows how gold might trade. For this type of corrective phase to occur, the low of wave C would have to be below the low of wave A. According to Elliott wave theory, the following describes the psychology during a zigzag corrective phase:
- Wave A: These waves are the most difficult to identify. During the development of wave A, most economic news will still be bullish and most traders and analysts see no more than a correction within a bull market. A sign of this wave, similar to wave 1, is an increase in the volume.
- Wave B: This is clearly a corrective wave in which many take the opportunity to resume the uptrend. But in reality this is no longer valid because we are now clearly at the stage of a corrective trend. There may still be positive news, but negative fundamental data begins to emerge. Volume of this wave is far less than during wave A.
- Wave C: The main feature of this wave is the fall in price with marked increase in the volume. The C-wave amplitude can reach 1.61 to 2.61 of the amplitude of wave A.
ELLIOTT, FIBONACCI, AND CANDLESTICKS
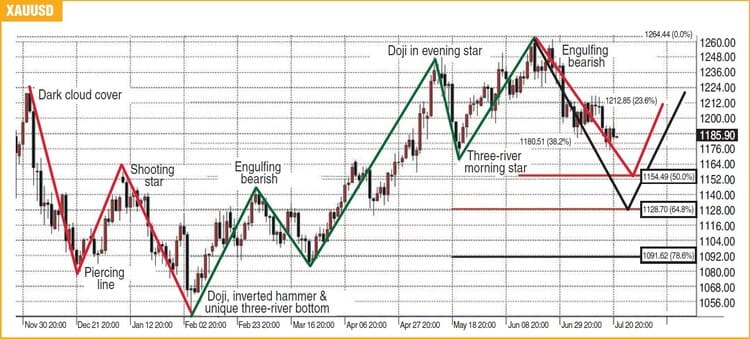
As gold trades in this correction, the last technical indicator in this filtering technique will come into play. I look for candlestick reversal indicators along with Fibonacci retracements to help determine when one wave has ended and another wave begins. As of now, we are at the 38% retracement level. This retracement is based upon the entire impulse phase from low to high (1045 to 1265). Figure 6 examines Fibonacci retracements and various candlestick patterns to see where wave A will end and wave B will begin. If $1,180 cannot hold as support, then the next level to examine will be $1,154. Both the flat or zigzag pattern can still be in play but they will start from the next lower level. I will use candlestick reversal patterns with Fibonacci retracements to determine if a support level will hold or become resistance as you can see from Figure 6.
We are not in a simple market correction but rather in a corrective phase. How much lower will gold trade? How long will this correction last? No one knows. But one thing we do know is that using the triad of Elliott waves, Fibonacci retracements, and candlestick patterns in the past has provided much insight and relevant market information. It makes sense that, properly used, the triad will continue to guide the trader–technician with reliable information and market insight.
I have an underlying market bias, as I am fundamentally bullish on gold. I believe that over time it will continue to increase in value, but there is no doubt that we are currently in a corrective phase. We need to pay close attention to our market indicators and plan accordingly.
How gold trades is something we can all speculate about. However, I am certain of two things. First, gold will offer us an opportunity for great profit if we know how to analyze it. Second, the gold market will also offer us moments of uncertainty. I hope that the technique contained here will allow you to experience more successes in your trades and less uncertainty in your market analysis.
Gary S. Wagner has been a technical market analyst for 25 years and is the coauthor of Trading Applications Of Japanese Candlestick Charting. A frequent contributor to Technical Analysis of STOCKS & COMMODITIES, he also codeveloped software applications for market forecasting. He produces a daily video newsletter, The Gold Forecast, for TheGoldForecast.com.