Trading Articles
Trading Forex Gold And Silver By Gary S. Wagner

Daytrade and position trade forex gold and silver using in-traday candlestick patterns. There is a fundamental difference in the way market technicians using candlesticks look at price data and movement compared to their line- and bar-charting counterparts. Line- and bar-charting traders emphasize a close-to-close relationship of market price. When they say that the Dow Jones Industrial Average (DJIA) closed up or down 100 points, they are comparing the closing price over the last two sessions. When those traders describe price movement, they are speaking of the change from session to session. They view that price change as a critical factor for gaining insight.
Intro
One type of chart that uses closing prices only is the line chart, which is created by connecting a series of datapoints with a line. The points we use are the closing prices. From this the trader moves to a bar chart, which plots the open, low, high, and close as a single line. The candlestick chart uses the same four price points but plots the information differently.
For the technician using candlesticks, the most important factor is the relationship between the opening and closing price of a session: Price change is most highly valued for market insight. When looking at market sentiment, it is the outcome of the battle between the buyers and sellers, those who think the price is overvalued and those who think the price is undervalued. This factor is the basis behind candlestick charts and their patterns. That is why there are so many types of single candles, each one telling a different aspect of the battle just waged.
PATTERNS DURING SHORT-TERM CYCLES
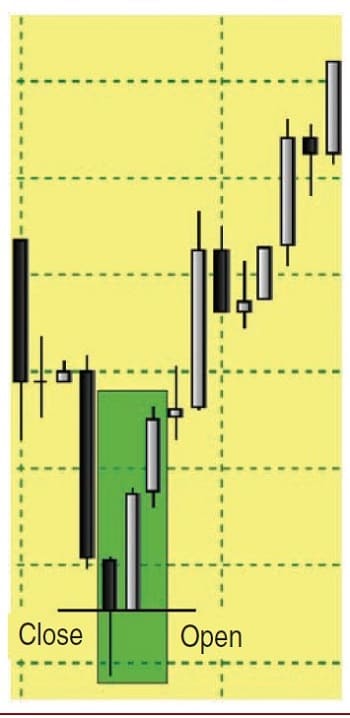
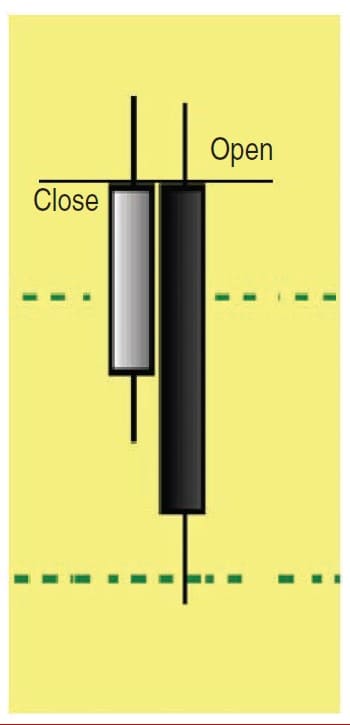
Candlestick patterns can provide insightful information with intraday signals for short-term trading and daytrading. There is one major difference, however, because the closing price of an intraday candle will be the same as the opening price of the following candle; we need to read the pattern a little differently. A bullish reversal pattern may have a close equal to the open of the following white candle. Figure 1A is an engulfing bullish pattern. This two-candle pattern occurs during a downtrend when the body of a black candle is engulfed by the following white candle’s body. Note that they have equal body lows. A bearish pattern may contain an equal close to the opening price of the following candle. Figure 1B is an engulfing bearish pattern. The close of the white candle is equal to the open of the following black candle. Another difference is that very short-term intraday (one-minute and five-minute) candles contain a large number of dojis when trading is thin or when the market is trading in a narrow channel.
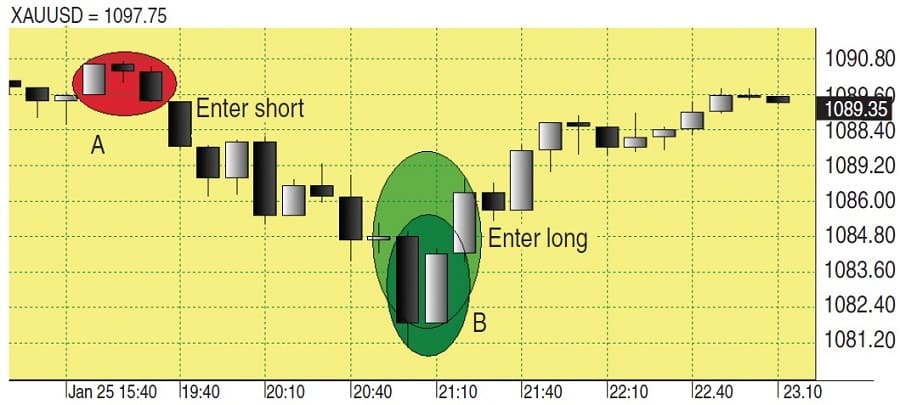
In Figure 2 you see a five-minute forex gold chart. A sell signal occurs when an engulfing bearish pattern is confirmed (A). About 35 minutes later, a dark cloud cover pattern occurs (B), which is confirmed on the following candle. Gold will lose $8 per ounce when it hits the intraday low and an engulfing bullish pattern signals a reversal (C). The following candle confirms this signal and breaks the resistance trendline on the following candle (C1). A three-river star (D) signals higher prices. This price action occurs over a time period of an hour and a half. Within this time frame, the price of gold was relatively the same. By capturing the intraday movement, the alert trader can profit from these moves.
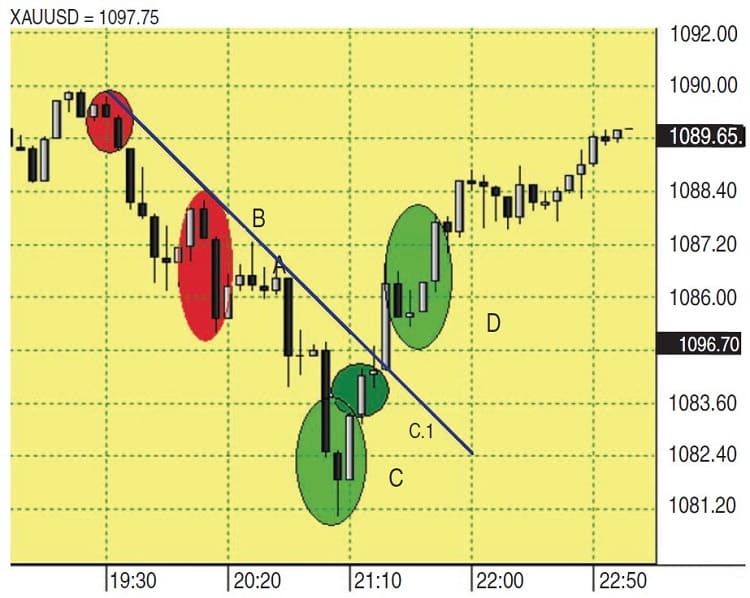
Figure 3 shows a forex 10-minute gold chart. At A, you see a bullish engulfing pattern that has issued a buy signal. Gold is trading at about $1,099.50 an ounce. The signal is correct and price continues to trade higher. The first real indication of a short-term top appears when a doji appears (B), followed by a black candle; however, the candle trades within the range of the doji, never trading with a lower low. It also trades strongly above the support trendline (D1).
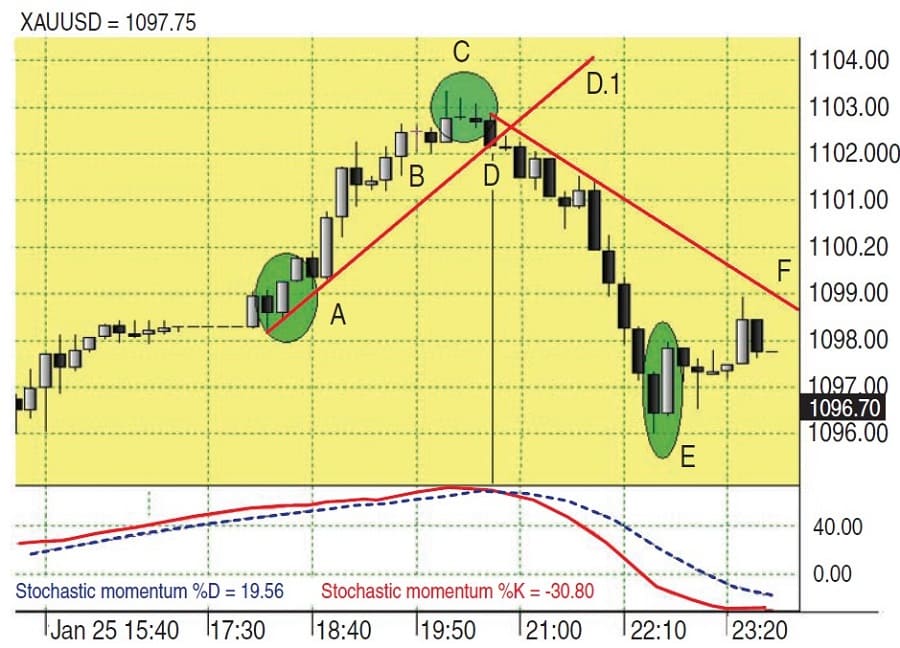
Thirty minutes later another doji forms in the star position as the market breaks above $1,103 an ounce (C), followed by a black small-bodied candle with a lower low, but it does not break the low of the prior white candle. The following black candle does trade with a lower low (D). The low crosses below the support line (D.1) and the stochastic %K crosses below the %D. This gives us a strong reversal indicator.
By reversing and entering a short position, the daytrader could have captured a $4 move, exiting when an engulfing bullish pattern appears two hours later (E). In four hours we saw trading opportunities using 10-minute candlestick patterns, coupled with trendlines and the stochastic oscillator. Another exit strategy would be to wait for the stochastic %K to cross above the %D or for the price to break above the resistance trendline (F).
Suggested Books and Courses About Candlestick Patterns
Figure 4 is also a 10-minute forex gold chart. A small black doji candle appears after a white candle (A). Because the close of the white candle and open of the black candle are the same, they cannot create an inside pattern (harami) or a star. The following candle is black and trades lower. It looks very much like a three-river evening star or a confirming harami pattern. Using the candlestick confirmation method, you would enter a short position on the following black candle and not see another candlestick pattern with the confirming candle until a piercing line pattern appeared 90 minutes later (B). A conservative trader would exit the short on the following confirming white candle, while the aggressive trader might reverse and enter long.
Longer time periods can be used for short-term position trades. These trades might last a couple of weeks or as short as a few days. Gold and silver came under pressure in the last months of 2009 and continued until the first months of 2010. Figure 5 is an hourly forex silver chart. From January 18 to January 22, 2010, the silver market dropped almost $3 an ounce. The market would trade at a lower low and then trade sideways, attempting to form a base. However, that base would be taken out with further selling. This bearish trending market would last the better part of four days.
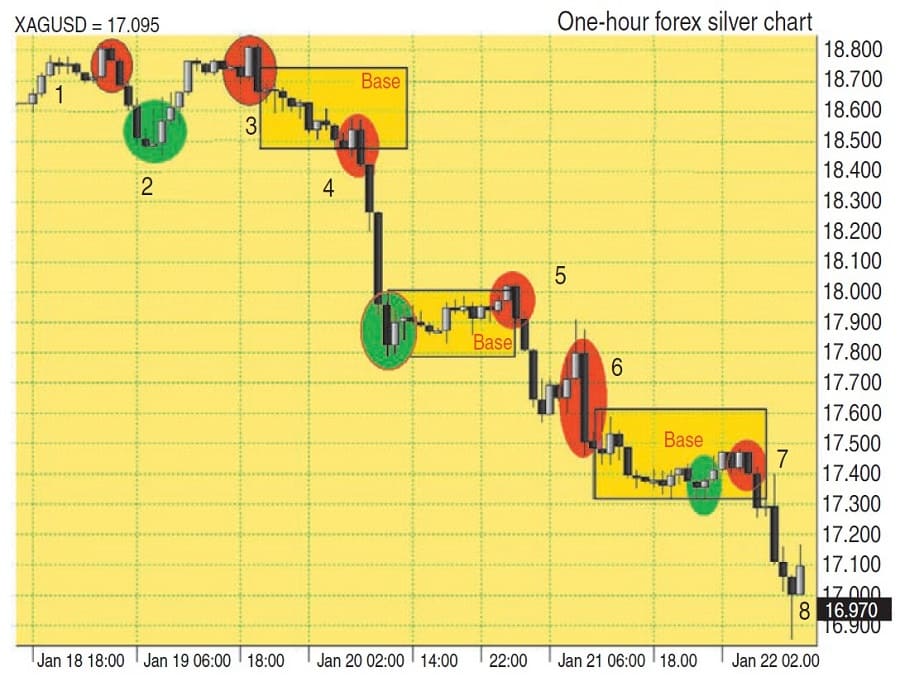
The hourly candlesticks provided traders with clear bearish signals. Five occurrences of the engulfing bearish pattern can be found during this selloff. Because the close of the white candles is equal to the open of the black candle, we need to read a forex chart in another manner when looking for patterns. The first sell signal found on the chart is at (1). It is an inside candle confirmed with the following black candle. Because the confirming candle takes out the low of the first white candle in the group, we can consider it a good signal; (2) would be the exit on the short sell.
The long doji followed with a long white candle would signal an exit. An engulfing bearish pattern occurs 11 hours later (3), followed by another engulfing bearish pattern at (4). Typically, we only look at the engulfing patterns as a reversal after a defined up- or downtrend. However, as you see in this example, with intraday charts and a strongly trending market, you will find these patterns as continued buying or selling accelerates. A piercing line occurs after a steep selloff.
After 13 hours of market consolidation, another engulfing pattern takes the market lower (5). Silver continues to trade sideways and then breaks lower. After silver trades below $18 an ounce, a large black candle engulfs the top of a short-lived rally as seen in (6). For 18 hours, silver attempted to again find support around $17.45, only to trade under pressure, breaking the $17 an ounce (7) level and then finding support at $17 with a hammer signaling the bottom (8).
THE OPEN AND THE CLOSE
To the technician using candlesticks, the critical factor is the relationship between the opening and closing price of a session. That price change is most highly valued for market insight, regardless of the time duration. That factor holds true with candlestick patterns. With that in mind, when using candlestick patterns for intraday market forecasting, you can get effective signals with many different time intervals.
Intraday candlestick patterns occur just like daily or weekly candlestick patterns. Think of each candle as a battle between the bulls and bears, and the outcome of that single candle the result of that battle. You can consider intraday candlesticks and their patterns as micro battles within the full cycle of a day. From there you can draw valuable information from a short-term candlestick pattern in the same way as daily or weekly candlestick patterns.
Gary S. Wagner has been a technical market analyst for 25 years and is the coauthor of Trading Applications Of Japanese Candlestick Charting. A contributor to STOCKS & COMMODITIES, he also codeveloped software applications for market forecasting.