Trading Articles
W.D. Gann Theory: Price, Time, and Geometric Market Analysis
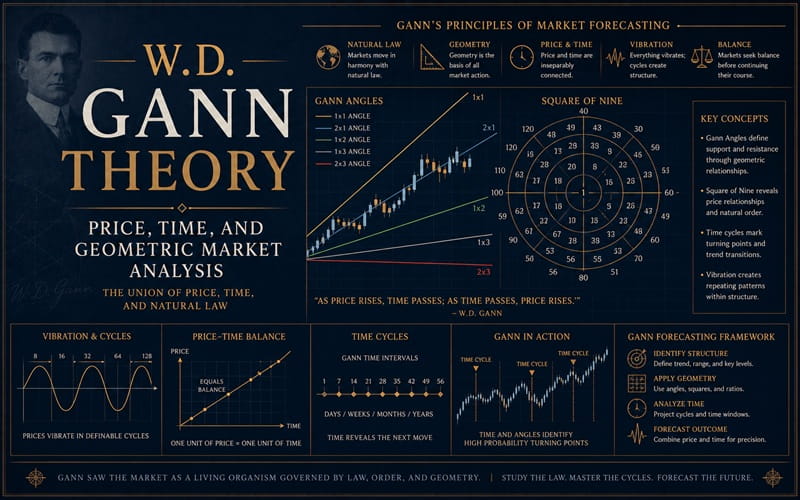
Gann Theory can be described as the study of pattern, price and time relationships and how these relationships affect the market. Gann Theory looks at pattern, price and time as the key elements in forecasting the future movement of the market. While each element has its own unique characteristics, each also has a unique, overlapping quality. The study and focus of Gann Theory is to find the interlocking relationship between these three primary indicators of changes in trend and market direction. In other words, in certain instances a pattern is having a large influence on the market while at other times price and time are exerting their dominance on the market.
It is the balance of these three elements – especially price and time – which create the best trading opportunities and often lead to more success in the market. Gann theory helps the trader to determine the best combinations of pattern, price and time to initiate successful trades. While trades can be triggered by each element individually, a trader who weights his signal too much toward one of these elements may experience a large number of losses while a trader who is patient enough to wait for a proper balancing of pattern, price and time may experience more success. Pattern, Price and Time Pattern study consists of the proper construction of Minor, Intermediate and Main Trend Indicator Swing Charts and Closing Price Reversal patterns. Price study consists of Gann Angle analysis and percentage retracements. Time study looks at swing timing, cycle timing and historical dates. The combination of these three factors helps the trader decide when and where to buy or sell. In this article, I will describe techniques which help the trader determine how to discover the elements through proper chart construction and how each are related in trading activity.
Gann Theory and Its Application to Trading Gann theory is based on the principle that price and time must balance. Markets are constantly in a position of change and subject to movement sometimes with great volatility. Gann Theory states that there is order to this movement. By using the proper tools to analyze this movement, an accurate forecast for future direction can be made. Finding the balancing points is necessary to predict future prices and movement. Gann developed a number of methods to help determine these balance points. The first method uses patterns created by swing charts to find the balance points. The second method uses angles and the squaring of price and time to find the balance points. Finally, the third method uses time. While the perfect market remains balanced all the time, it also proves to be uninteresting because major moves occur when price is ahead of time or time is ahead of price. The proper use of the various Gann analysis tools will help you to determine when these major moves are most likely to occur. The 7 Steps for applying Gann Theory to trading.
Advanced Books and Courses on W.D. Gann Methods
Now that the theory has been explained, how can it be applied to trading? The first step is to create the charts which properly demonstrate the concepts of pattern, price and time analysis. The second step is to create swing charts or trend indicator charts which provide the trader with a way to analyze the size and duration of the rallies and breaks. The third step is to use the information derived from the swing chart to forecast future price and time targets. In addition to forecasting, this chart is also used to determine the trend of the market. After the pattern has been analyzed in the form of the swing chart, the trader moves to step four which is the creation of Gann angle charts. Using the tops and bottoms discovered with the swing chart, the trader draws properly scaled geometric angles up from bottoms and down from tops. Since these angles move at uniform rates of speed, the trader uses the angles of support or resistance and attempts to forecast the future direction and price potential of the market. Percentage retracement levels are also created using the information derived from the swing charts. Each paired top and bottom on the swing chart forms a range. Inside of each range are the percentage retracement levels. The strongest being the 50 percent price level.
Step five is to draw the percentage retracement level inside of each range. At this point, the trader can judge the strength or weakness of the market by relating the current market price with the percentage levels. For example, a strong market will be trading above the 50 percent price. Finally, time studies are applied to the market in step six. Traders should use historical charts to search for anniversary dates and cycles that could indicate the dates of future tops and bottoms. The swing chart is used to forecast the future dates of tops and bottoms based on the duration of previous rallies and breaks. Gann angle charts are used to predict when the market will be squaring price and time.
Finally, the percentage retracement chart creates the major time divisions of the current range with 50 percent in time being the most important. Step seven is to combine the information obtained from the pattern, price and time charts into a trading strategy. This is the most important step because it demonstrates where the three charts are linked. For example, the swing chart tells the trader when the trend changes. If the trend changes to up, the trader uses the previous rallies to forecast how far and how long the rally can be expected to last.
The Gann angles drawn from the swing chart bottom show the trader uptrending support which is moving at a uniform rate of speed. In addition, the Gann angle chart shows the trader the time required to reach the swing chart objective based on the speed of the Gann angle. The 50 percent price level acts as support when the market is above it and as resistance when it is below it. The strongest point on the chart will occur at the intersection of the uptrending Gann angle and the 50 percent price. Finally, time indicators are used to prove to the trader the upside target is possible because anniversary dates and cycles can verify the existence of similar market movement in the past. In Conclusion … By combining pattern, price and time, the trader creates a trading strategy. This trading strategy is based on the principle of price and time balancing at certain points on the chart. The three methods of analysis draw this information out of the chart. Without the proper application of the three analysis tools, valuable information would be lost to the trader. This is the very essence of Gann theory, which states there is order to the market if the proper tools are used to read the charts.
- James A. Hyerczyk is a noted Gann expert, commodity trading advisor and president of J.A.H. Research and Trading.
James ” Is APHLF for real??????????????????????-“
James —I’m reading Gann Theory