Trading Articles
Fibonacci Tools By Alexander Sabodin
Here’s a look at the numbers behind the Fibonacci sequence and how it can be applied to your charts. The sequence of the Fibonacci numbers is considered to have been discovered by Leonardo of Pisa, better known as “Fibonacci,” a 13th-century Italian mathematician.(“Fibonacci” is an abbreviation of filius Bonacci; filius is Latin for “son of.”) In the early 1200s, after traveling through parts of the Middle East and studying with Arab mathematicians, Fibonacci published his book Liber Abaci, or “Book of Calculation,” which introduced to the West something that is one of the greatest discoveries of all time: the decimal numeration system, including the position of zero as the first number in the number sequence. This system, known as the Hindu-Arabic numeral system, includes zero, 1, 2, 3, 4, 5, 6, 7, 8, and 9 and is commonly used today instead of Roman numerals.
Fibonacci became one ofthe best-known mathematicians of his time. He wrote three essential, ground-breaking books on mathematics: Liber Abaci, published in 1202 and updated in 1228; Practica Geometriae (“Practical Geometry,” a compendium on geometry and trigonometry), published in 1220; and Liber Quadratorum (“The Book of Squares”).
THE FIBONACCI SEQUENCE
In Liber Abaci, Leonardo presented the following task: “How many couples of rabbits, placed into a rabbit corral, can be produced for a year by a rabbit couple, if each couple produces one more couple every month since the second month?” This resulted in the Fibonacci sequence of numbers:
- 1, 1, 2, 3, 5, 8, 13, 21, 34, 55, 89, 144…
The mathematic sequence begins with 1 and the next number forms the sum of the two previous ones:
- 1 + 1 = 2; 1 + 2 = 3; 2 + 3 = 5; 3 + 5 = 8…
Why is the sequence so important? The sequence strives for a constant ratio slowly, but this ratio is irrational — that is, a number with an endless and unpredictable sequence of decimal numbers in the fractional part. It is impossible to express it precisely. If any number of the Fibonacci sequence is divided by the previous one (for example, 13:8), the result is a value fluctuating around an irrational value (1.61803398875…). But it would be impossible to determine the exact ratio to the last decimal number, and hence, it is represented as 1.618. This ratio has been referred to by other names, ranging from “divine proportion” in ancient times to the “golden section,” the “golden average,” or the “ratio of rotating squares” (or logarithmic spiral). The mathematician Johannes Kepler called the ratio “one of the treasures of geometry.” In mathematics, the Greek letter ϕ (phi) is adopted as the symbol of the ratio:
- ϕ equals 1.618
It has also been referred to as the “golden coefficient.” The Fibonacci sequence as well as its numbers can have numerous combinations. This is not just a game with numbers, but the most important mathematical expression of natural phenomena. The best-known and interesting applications of the mathematical sequence are the pyramids of Egypt and Mexico, and the plants found in nature!
FIBONACCI RATIO IN GEOMETRY
Mathematical properties of these ratios are not of great practical interest to us. Although this is not intended to be a lecture in geometry, it could be worth your while to pay some attention to the main examples that have some importance to trading.
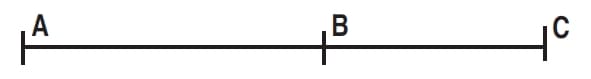
Golden section: Any segment may be divided in such a way that the ratio between its smaller and bigger parts will be equal to the ratio between the bigger part and the whole segment (Figure 1). This ratio is always equal to 0.618. But this is not just algebraic division of a segment into two equal parts. The golden section can be found in nature. The human body is an embodiment of the golden section in everything, from general dimensions to the arrangement of the human face. Art is significantly improved through the application of the golden section, and its value and application were especially notable in ancient Egypt and Greece and during the Renaissance.
Leonardo da Vinci himself believed that the golden proportion was of great value and applied it to many of his paintings. Further, such expressions as the gold rectangle and the golden spiral (logarithmic spiral) exists in geometry. In order to draw them accurately, you must employ the Fibonacci ratio.In nature, the golden proportion can be seen in diversity such as spiders spinning their cobwebs as logarithmic spirals, pine cones, snail shells, ocean waves, ferns, sunflower and daisy seed arrangements, all of which form logarithmic spirals. In addition, the Fibonacci sequence is the mathematical base of the Elliott wave theory. Fibonacci numbers are even mentioned as the answer to a puzzle in Dan Brown’s best-selling novel, The DaVinci Code.
Suggested Books and Courses About Fibonacci Trading
FIBONACCI SEQUENCE IN THE MARKET
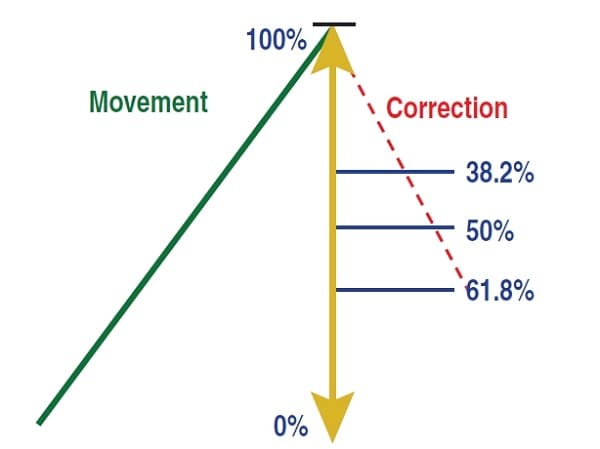
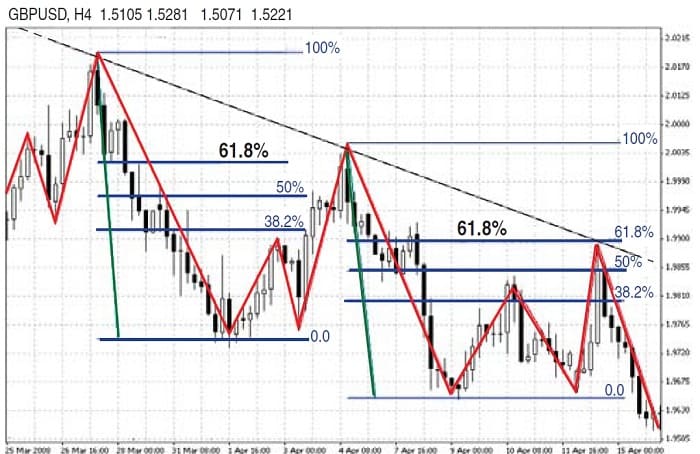
The existence of Fibonacci ratios in geometry is well known. The application of these ratios in trading is gaining popularity as well. A glance at a price graph suggests that price movement is an alternation of rises and falls. With an ascending trend, each rise and fall is higher than the previous. But how can you measure the length of the emerging correction? One of the most popular methods is to apply Fibonacci levels. There are three major correction levels — 38.2%, 50%, and 61.8% (Figure 2). During a strong trend, a correction amounts to approximately 38.2%. A pullback during the middle of a trend could last up to 50% and in the case of a deep correction, the trend should be expected to finish close to the 61.8% level. Out of these levels, 61.8 could be the most important because after the 61.8% level is broken, the trend that existed prior to the break no longer exists.
When trading conservatively within a trend, it is the 61.8% level that traders consider to be the most important and reliable. In addition, the entry point from the 61.8% level provides the best potential profit/loss ratio (Figure 3). Take the following situation. When you wait for a correction after an ascending trend movement, you always have a guiding point for setting the first profit-taking target (T/P). Usually it is the last high set by price, since it is the nearest resistance level. It is reasonable to place a stop-loss (S/L) below the support level from where the ascending price movement started. Look how much your profit exceeds your risk, and how much worse the ratio between S/L and T/P would have been if you entered your trade at the 38.2% or 50% and placed your S/L below the same support.
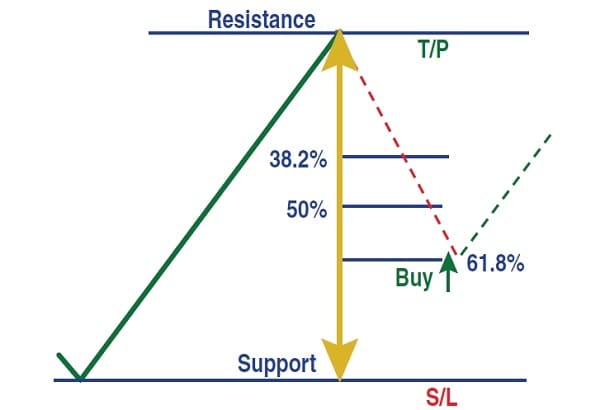
Of course, it is more profitable to buy from the support level, but do not forget that we act based on the fact that we are within the trend. Figure 4 shows an example of how the 61.8% correction level can work favorably.
FIBONACCI EXPANSION
Fibonacci expansions are created by identifying three points that describe two waves. You then draw three lines intersecting the “assumed” waves at the Fibonacci levels 61.8%, 100%, and 161.8% (Figure 5). Significant price changes should be expected near these lines. This case is subject to the following logic: According to Dow theory, the main trend has three development phases. The first phase is regarded as a mere bounce from the support level. The phase with the largest potential for profit gaining is the second phase. During the second development phase, traders who use technical methods of following the trends enter their positions. Prices rise vigorously, and economic information becomes more optimistic.
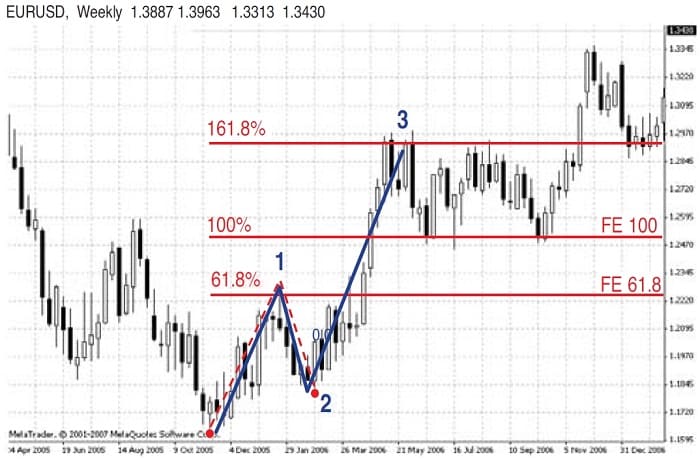
As a rule, the second phase (in wave analysis it is referred to as the third wave) cannot be smaller than the first. According to Elliott wave theory, the second phase either equals the first or frequently exceeds it by 1.618 times. In Figure 5 the third wave appeared to be longer than the first by 161.8%. These values can be used to forecast the target.
DO FIBONACCI LEVELS WORK IN TRADING?
You can always check the performance of the Fibonacci values by applying them to historical charts. You can apply the Fibonacci correction levels and expand on any time scales with similar success. When you use them with other technical analysis tools, they can become useful assistants in your work.
Alexander Sabodin is a private trader, analyst, and advisor for the forex market in Belarus.