Trading Articles
Fibonacci In Time And Price By David Knox Barker

You can apply this technical tool of cycle analysis to smaller market cycles, which are more useful to traders than the larger ones. In Business Cycles, the seminal work on the title subject, economist Joseph A. Schumpeter presented a framework for business cycle analysis that included the Kondratieff economic long wave as his essential tool for understanding and describing the capitalist process. His work goes a long way to explain the cyclical expansion and contraction of international free market capitalism and related global financial market activity, including the current global financial crisis and impending debt collapse.
DIVIDING CYCLES
Schumpeter also presented a framework for smaller cycles that included 18 regular trade cycles, or Kitchin cycles, in every long wave. I accepted this concept when I read Schumpeter’s work in the 1980s, but then in the early 1990s I discovered another system for understanding the long wave family of cycles in the work of the late market technician “PQ” Wall. Years of extended research on the technical implications of Wall’s cycle work led me down a path of technical analysis that I refer to as “theory 144 analytics.”
Central to Wall’s approach is what he theorized as the in-herent “threeness” and “fourness” of cycle relationships. His conclusions were derived from his knowledge of world history and his unorthodox approach to markets and philosophy. “PQ,” his nickname, was short for “philosophy quotient,” and his philosophy played a major role in his distilling cycles and their interrelationships into a novel system of divisibility — that is, threeness and fourness.
Wall divided a long wave by four into spring, summer, autumn, and winter and further divided the long wave seasons by four into the regular trade cycles (Kitchin cycles). Wall’s method gives you 16 regular trade cycles in a long wave instead of Schumpeter’s 18. This may not appear to be a major distinction, but it is an important contribution to cycle research and technical analysis, due to the downstream implications for the smaller cycles and the clarity his discovery provides.
Suggested Books and Courses About Fibonacci Trading


Critics of long wave theory often complain that long wave theorists use idealized charts. But the problem lies in what most analysts struggle with, which is when the long wave began. Robert R. Prechter Jr. was the first to identify the start of the current long wave as 1949. Once you understand the fundamental forces of the long wave, then real data charts that tell the long wave story are clear and powerful tools of observation.
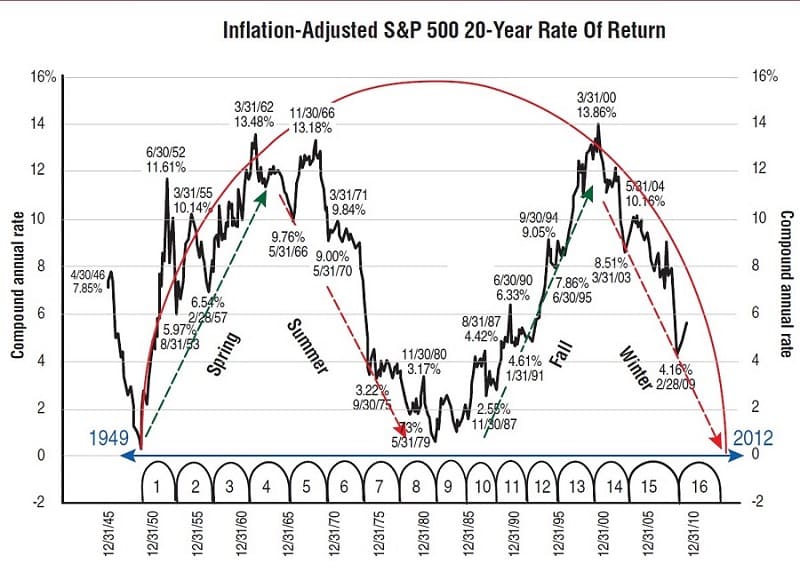
Figure 1 demonstrates not just the long wave and the long wave seasons, but if you look closely enough, you will also see the 16 regular trade cycles. Wall was fond of saying that “pattern is the sunlight of the mind.” He also wrote about his belief that pattern recognition was at least partially genetic. Some people see patterns, others don’t. It may be that most successful traders have the pattern recognition gene. If you can see the patterns, you may want to further explore more advanced technical tools of cycle analysis applied to the smaller cycles. The smaller cycles are far more useful for traders than the larger ones.
THE SMALLER CYCLES
Drilling down into the smaller cycles of long wave dynamics leads us to Wall’s next step. He took the regular trade cycle and divided it by three, to get a “Kitchin third,” and then divided by three again to get one of the most important cycles for traders. By simple division this cycle is 144th of the long wave. Typically, most traders recognize this cycle as the 20-week cycle. I refer to this cycle as the “Wall cycle,” since PQ Wall discovered its true nature; it is a miniature long wave. The idea that there are 144 Wall cycles in a long wave has far-reaching implications for technical analysis. The wave dynamics produced by the Wall cycle are highly relevant to traders.
FIBONACCI RATIOS IN TIME
My fascination with Fibonacci ratios in price and time and knowledge of Wall’s work led me to pick up where he left off. I began to explore the 16 regular trade cycles in a long wave in relation to the notion of Fibonacci ratios in time. Most technical analysts have observed that the trade cycle usually does not manifest in exact lengths, fluctuating within a range. Statistician Joseph Kitchin, for whom the cycle is named, himself thought they averaged 40 months. Most market analysts have experienced frustration in grappling with cycles and their lack of consistency, particularly the regular business cycle.
This is where long wave dynamics and theory 144 analytics get interesting. In the mid-1990s, experiments with “ideal” lengths of the Kitchin cycle were conducted. The search was on for Fibonacci ratios in time relative to a possible ideal length. I experimented with different lengths, but when I plugged 42 months into the Fibonacci date target model and looked for hits in real data relative to ideal lengths, I discovered that the Kitchin cycle appeared to regularly hit Fibonacci ratio targets in time relative to the ideal of 42 months. For those with an interest in physics, quantum mechanics, and field theory, Fibonacci ratios in time appear to represent the degrees of freedom in cycles; in essence, cycles appear to be fields of human action.
What is particularly exciting about this discovery is that although smaller cycles tend to deviate from their ideal, the method appears to become more accurate for discovering exact target dates with the smaller cycles. If the ideal Kitchin cycle is 42 months, and you divide by three then three again to get a Wall cycle, then the ideal Wall cycle is 141.9 days.
Further, backtesting Fibonacci ratios in time relative to Wall-cycle starts provides for a startling number of hits on major market turns. When you divide the Wall cycle by four, you get “Quarter Wall” (QW) cycles. There are four 35.475-day cycles in a Wall cycle. By utilizing stochastics to look for overbought and oversold conditions, which also line up with the cycles of Fibonacci ratios in time and price, traders have a new set of tools in their technical toolbox.
IDENTIFYING BUY/SELL OPPORTUNITIES
Expanding this Fibonacci approach to the larger cycles, long-term investors can look for opportunities to buy and sell equity positions. The current long wave, which began in 1949, is clearly running longer than expected; the 16 Kitchin cycles are also. We are looking for the current and final Kitchin cycle, no. 16 of this long wave, to bring this wave to a close in 2012.
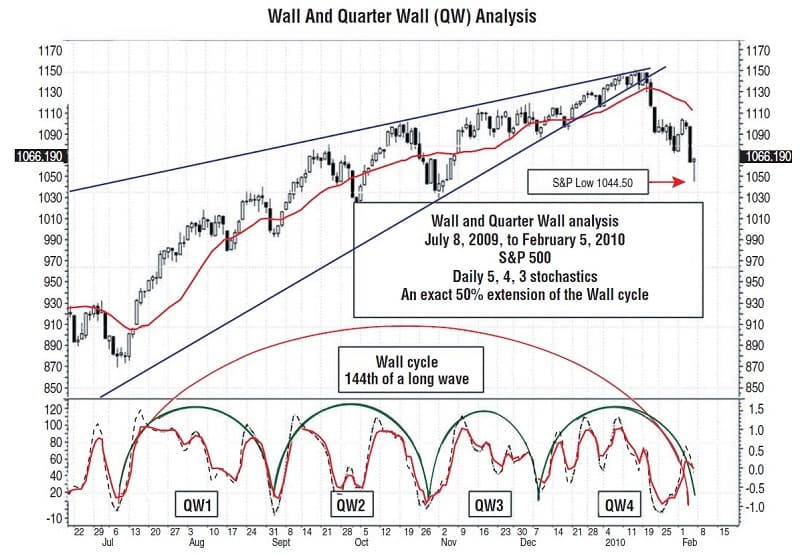
One interesting example can be seen in Figure 2. The July 8, 2009, low was clearly the bottom of the Wall (20-week) cycle. However, the long wave is running long and the Kitchin cycles are as well. This means that Wall cycles are also doing so. Cycles may have been running longer than their ideal lengths in recent decades due to government fiscal stimulus and aggressive monetary intervention from central banks around the world. Stimulus was at all-time highs from aggressive monetary policy, the “cash for clunkers” programs, and housing tax credits in a recent Wall cycle.
Suggested Books and Courses About Market Cycles
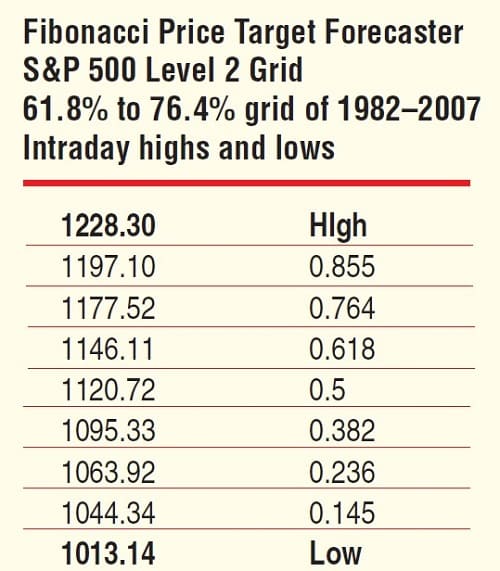
Looking for the cycles to be running long relative to their ideal lengths, I focused on February 5, 2010, because this date was a possible market bottom and turn date for the 50% extension in time of a 141.9-day Wall cycle that began on July 8, 2009. There was also the 1044.33 target on the Standard & Poor’s 500 using Fibonacci in price in a Level 2 drilldown in price of the 1982 low to the 2007 high, so an intraday print of 1,044.50 of February 5, 2010, came as no surprise. During the next leg down in the bear market, my expectation is for the Wall cycles to die young and hard in QW1 and QW2.
Elliott wave analysis proponents may find the relationship to various combinations of three and four cycles worth considering. Four cycles provides for a total of eight moves — three plus five in either direction. Theory 144 analytics can provide clarity to the Elliott wave count. The stock market rally on the front end of the final Kitchin cycle, no. 16 of this long wave winter season, may have played itself out. A global debt bust deflation is now under way. A global debt crisis could hammer global equity markets in a wave of deflation into a long wave bottom in 2012.
AFTER 2010
In spite of a dire assessment of the near future, things could perk up beyond 2012. The unprecedented scale of the global financial and debt crisis will force massive political and economic restructuring in favor of markets. This global crisis has the potential to produce a new golden age for international free market capitalism. In the meantime, traders should aim to trade both sides of the Wall cycles and the QWs.
David Knox Barker is the founder of Long Wave Dynamics as well as the publisher and editor of “The Long Wave Dynamics Letter.” Barker, an expert on the economic long wave and stock market cycles, is the author of Jubilee On Wall Street, published earlier as The K Wave. He is a writer, inventor, entrepreneur, technical analyst, and world-systems analyst. He has researched stock market cycles and written on the impact of the long wave on international financial markets and the international political economy for more than 25 years.