Trading Articles
Does Gold Still Have Room To Run? By Teresa Fernandez
The futures volume open interest indicator will tell you. Many investors are hesitant about investing in gold. Memories of the stratospheric and unexplained rise to the unchartered territory of the high $800s in January 1980, followed by several limit-down days, still haunt baby boomers, many of whom had never before witnessed such action in their entire investing lives. In three short months, gold plunged from its all-time high of $873 on January 21, 1980, to $453 on March 27, 1980, or a drop of 51.9%. But it didn’t stay there; the precious metal inched back up, reaching $729 on September 23, 1980, an encouraging gain of 60.9%.
Eventually, the rally petered out and gold dropped once again, touching $297.50 on June 21, 1982, or a loss of 59.2% in 21 months. By this time the luster of gold had worn off and investors had had it with the metal. But the question remained: Would gold ever go back up to its old highs?
A DETAILED LOOK AT GOLD
Someone made money during that rise in gold throughout the 1970s. Who? The heavy hitters with millions to play with, who are in touch with the supply and demand situation of gold on a daily basis — these traders generate enough trading volume to affect the open interest in gold futures, which then allows ordinary investors to keep track of them, albeit from a distance.
Volume is an easy concept to understand. It is the number of contracts traded during a particular period, be it daily, weekly, monthly, or annually. Price will move more on heavy volume than on light volume. When it comes to stocks, heavy volume on the buy side usually leads to higher prices in the future, and conversely, heavy volume on the sell side leads to lower prices. This is not the case with futures. Stocks can be held for many years, perhaps even decades, because the ownership in businesses that stocks represent does not expire. Investors buy and sell stocks at their discretion at a time of their choosing.
On the other hand, futures contracts expire. Trading in December 2010 gold, for example, ends on the third to the last business day of December 2010. Those who are still long as of close of business on that day are obligated to buy 100 ounces of gold for every contract they hold. And those who are short are obligated to deliver 100 ounces of gold for every contract they are short, which COMEX then delivers to those who are long the contract on the close of the last trading day.
Most traders do not really intend to buy or sell physical gold covered by the COMEX gold contracts. To avoid unwanted transactions, all traders who hold positions in December 2010 gold should close their positions on or before the last trading day. This brings us to the term “open interest.”
WHAT IS OPEN INTEREST?
Open interest refers to the number of contracts that have not yet been settled on or before the contract’s preassigned settlement date. For each buyer of a futures contract, there is a seller. From the time the buyer or seller opens the contract until the opposite side closes it, that contract is considered open. Increasing open interest is an indication that new money is coming into the market, which will contribute to the continuation of the present trend. Conversely, declining open interest means that money is going out of the market and implies that the present trend may be coming to an end.
Open interest is a concept all gold investors need to understand. It is always included in most futures quote displays, along with bid price, ask price, and volume, but for some reason most traders and, for that matter, gold investors, ignore open interest.
First, let us analyze what exactly open interest represents. Unlike trading in stocks, in which the total shares outstanding of a particular stock is exactly the fixed number of shares of that stock that can exchange hands, futures trading can involve the creation of a new contract when a trade is placed. This happens when the demand for a contract is such that there are no more open contracts available to trade.
Open interest should be used in two ways. First, look at open interest relative to the volume of contracts traded. When the current day’s volume exceeds the previous day’s open interest, you know the demand for this contract was so high that new money was flowing into this market, new contracts had to be created to meet the demand, and the current trend will probably continue. When the current day’s volume does not change open interest or reduces open interest, you know that the current trend may be weakening and coming to an end.
Second, look at open interest relative to price. When both price and open interest are rising, the trend up is strong and likely to continue. When the price is rising but the open interest is falling, it means shorts are covering rather than new longs coming into the market, which means the current trend up is weakening or ending. When prices are falling and open interest is rising, it means new money is shorting the market, making the market very weak. And finally, when price and open interest are both falling, that means longs are closing their positions rather than new shorts coming into the market, which means the current trend down is probably ending.
FUTURES VOLUME OPEN INTEREST (FVOI)
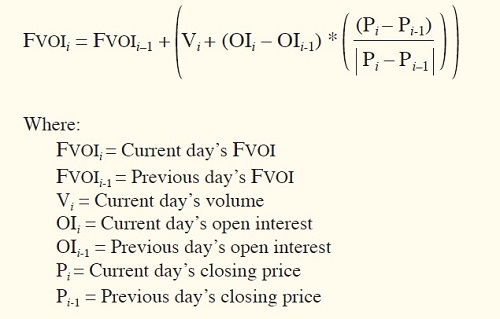
The futures volume open interest (FVOI) indicator is a variation of on-balance volume (OBV). FVOI is calculated the same way as OBV, with one exception — the change in open interest from the previous day is incorporated into today’s volume as follows:
- When both the current day’s price and open interest are higher than the previous day, add the change in open interest to the current day’s volume. This emphasizes that higher price and higher open interest means a strong uptrend.
- When the price is rising but open interest is falling, subtract the absolute value of the change in open interest from today’s volume. This penalizes today’s volume since the rise in price is caused by traders closing positions rather than new money coming into the market.
- When prices are falling but open interest is rising, we subtract the change in open interest from today’s volume. This also penalizes the volume in order to emphasize that new shorts are coming into the market, making the market very weak.
- When both price and open interest are falling, add the absolute value of the change in open interest to today’s volume to emphasize that the current trend down may be ending and an uptrend may be emerging.
- On the rare occasion when there is no change in open interest from the previous day, simply add or subtract today’s volume (like OBV) to the previous day’s FVOI. The FVOI for each day is calculated as follows:
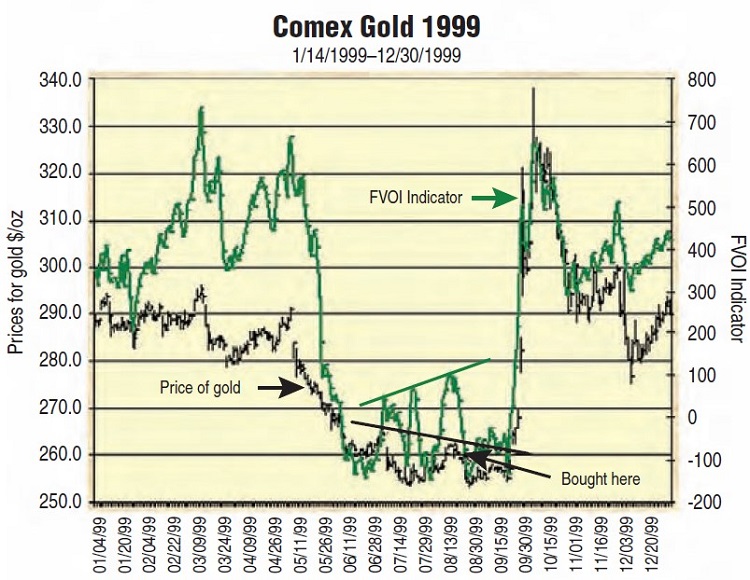
I tested this by superimposing the FVOI on a chart of gold, producing charts every year from 1976 to 2010, buying when the FVOI trended up when the price was flat or trending down and selling when the FVOI trended down when the price was flat or trending up. For example, in Figure 1, the chart of Comex gold 1999, during the July–August period, the price eked out lower highs, but the FVOI showed higher ones. I went long at $260 on August 18, 1999.
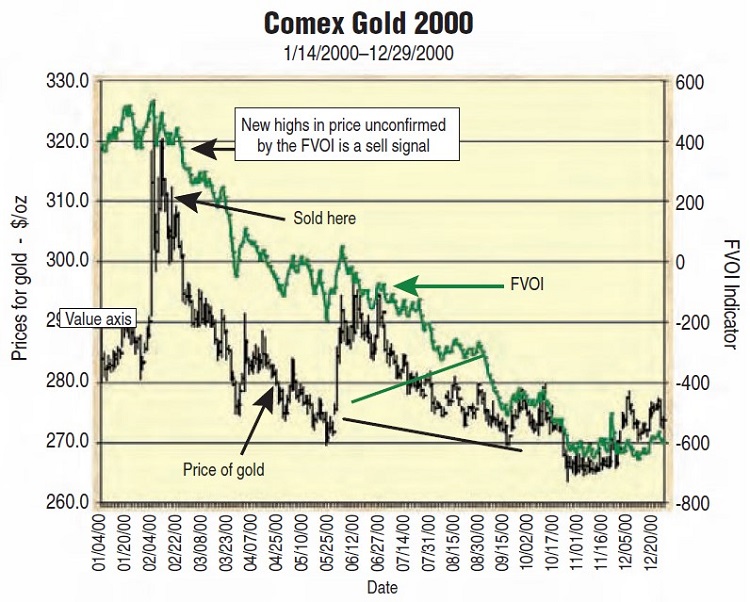

The chart of Comex gold 2000 in Figure 2 shows a perfect example of a spike up in the price of gold, unconfirmed by the FVOI. This was a sell signal. I sold at $310 on February 22, 2000. I also sold when the price exhibited a “Falling off a cliff” pattern, which is a big drop in price for three or more straight days in a row, but only if it was confirmed by a down move in the FVOI (see Figure 3).
The “Falling off a cliff” pattern that appeared in February 1983, confirmed by a drop in the FVOI as well, indicated a sell signal. I sold in July 1983 when the FVOI made a new low for the year, confirming the bearishness of the pattern. The results of the FVOI indicator buy and sell signals can be seen in Figure 4.
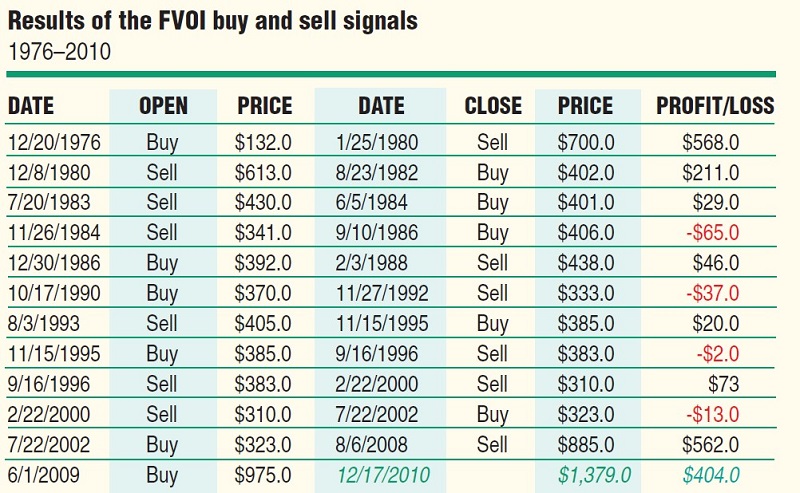
Note in the profit/loss column that there was a $568 per contract profit from 1976 to 1980, a 430% profit in just over three years. And we know gold peaked at $873 on January 21, 1980. During the 22-year period from 1980 to 2002, gold did nothing meaningful for investors. Investment advisors did not recommend it because it earned no interest or dividends and went nowhere. Perhaps the most difficult aspect of the gold market that investors have to contend with is the length of its cycle from when the last bull market peaked to when the next bull market begins — approximately 20 years. Investors tend to ignore a market that does nothing for them for years on end, and by the time gold starts its final, meteoric run to the peak, it’s often too late to get in.
Suggested Books and Courses About Market Indicators

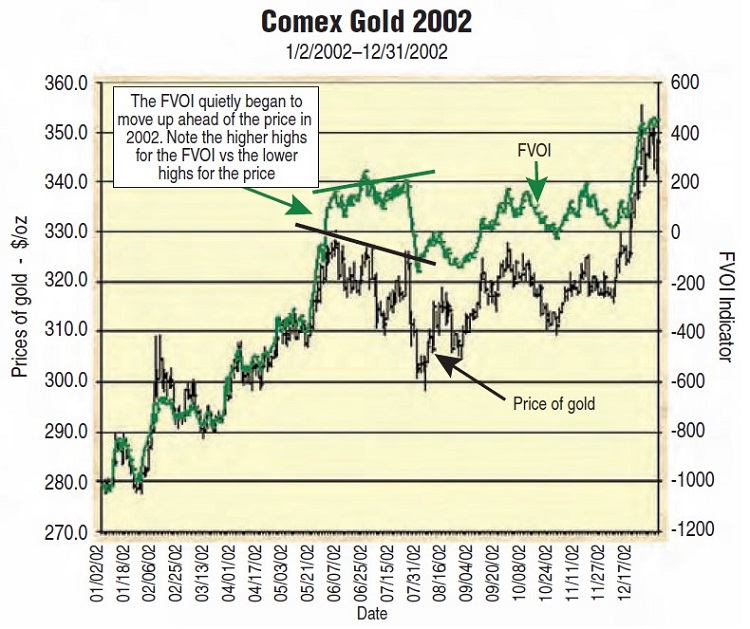
In 2002, no one, including the media, was paying attention to gold, and yet, the FVOI began to quietly pull away from the price action, trending up when the price action was indecisive (see Figure 5).
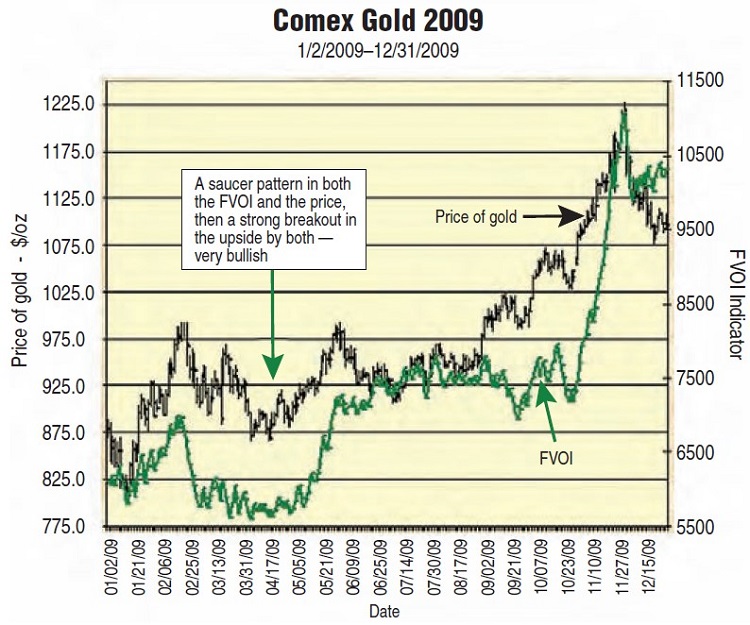
The FVOI trended up six straight years from July 2002 to August 2008, bringing the price along with it, for a profit of $562 per contract. Since there were no clear signals or divergences from August 2008 to June 2009, we stayed flat. In June 2009, the FVOI gave another buy signal, a signal still in force as of this writing. Figure 6 shows the price action of gold and the FVOI in 2009.
Note the very bullish saucer bottom in the price, confirmed by the FVOI indicator during the March to June period. Now that gold has traded over $1,400 an ounce, we are starting to hear that dreaded word “bubble.” Is gold in a bubble at these prices? Well, we know that gold was in a bubble in January 1980. Looking back, we can recognize bubbles, since we all have perfect hindsight. In Figure 7, you see the chart of gold in 1980.
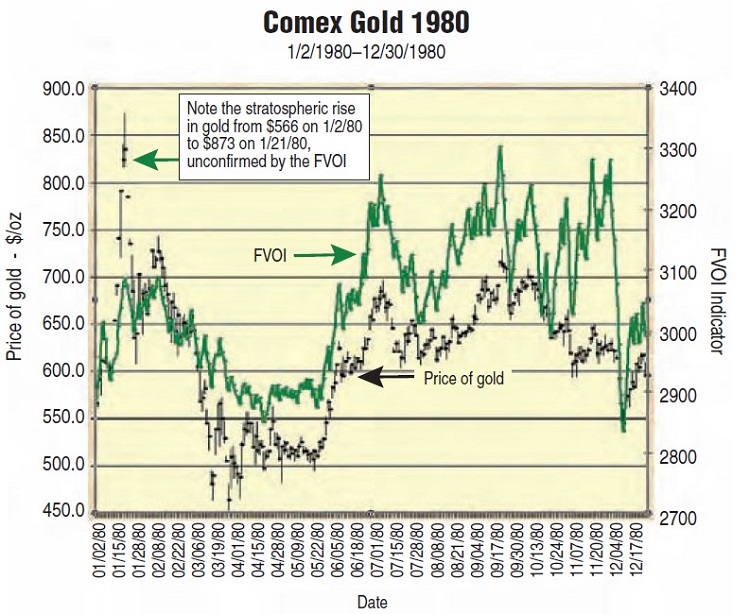
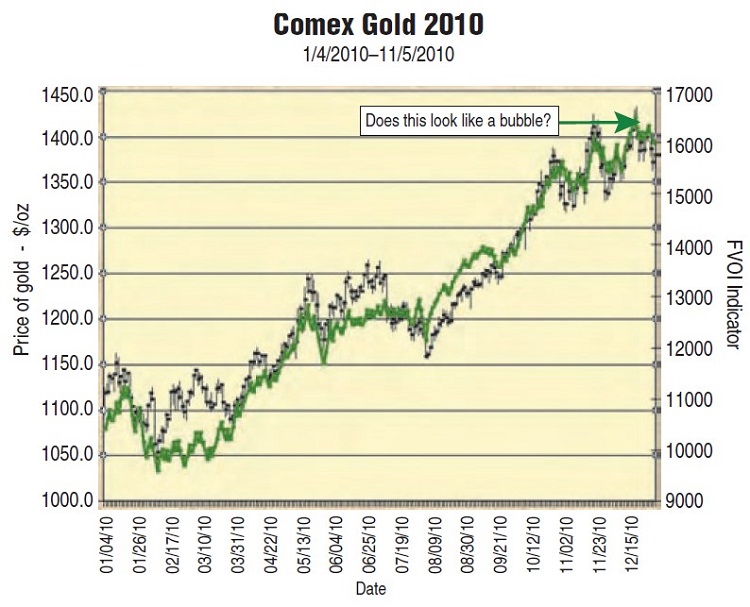
Note the skyrocketing rise of gold from $566 on January 2, 1980, to the unchartered waters of $873, unconfirmed by the FVOI. There was no new buying here — just panic-stricken shorts frantically closing out their positions. Compare this with the chart of gold in 2010 (Figure 8), which the public is now calling a “bubble.” The 2010 chart of gold does not have the appearance of a bubble, but it does look like there’s a lot more room on the upside. Price is moving up steadily and in an orderly manner, and the FVOI is confirming.
What investors should learn from this exercise is that in order to invest in gold prudently, they should track gold all the time, even during the years that it is not doing anything. Since the quantity of gold on earth is finite (gold cannot be manufactured), the general direction of gold prices is up, with intermittent and seemingly interminable inactivity or downside action, which tend to drive investors away. Prudent investing in gold means buying before the market has made its move, when prices are still lower, the action is quiet, and the risk is at a minimum.
Teresa Fernandez is a private investor and a technical analyst of the US financial markets. Since earning a master’s degree in finance from the Wharton School of Business, she has researched disciplines that can be used by the ordinary investor in order to make money in the US financial markets. Fernandez has taught her philosophy of disciplined investing since 1997.