Trading Articles
Day Trading Decision Areas Using Fibonacci and Stochastics
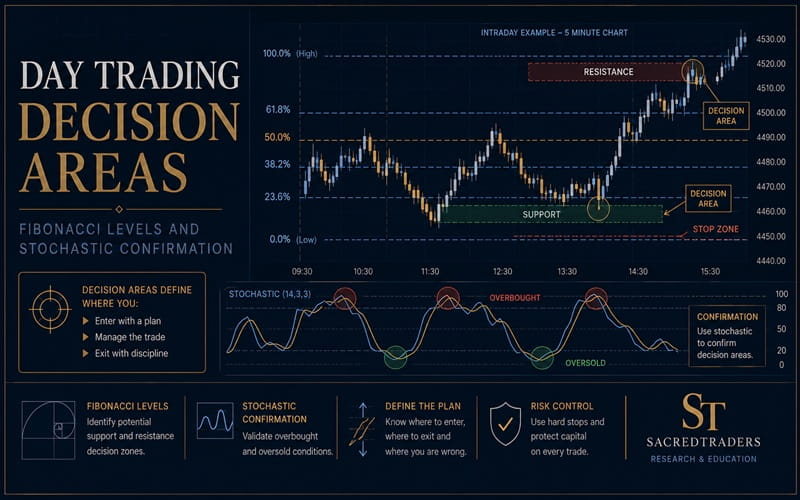
It’s impossible to know when the market will suddenly turn and move in another direction. But there are tools you can apply to your charts to identify those probable turning points. Here’s a simple technique any intraday trader can use. A trader with a small account is in a precarious situation judging when to take a position or to stay out of the action. He is normally a person who wants to be trading in the markets, who is anxious to be involved and often thinks more of the reward than the risk. This is the reason that so many people who try to scalp—that is, take intraday positions for short periods trying to capture a few points during the day—so often come to grief. Trying to guess which way the market will go from one minute to another is a perilous adventure. Often, you can be right in one time frame and wrong in another, and if you’re wrong in the smaller time frame, it may be too late for you by the time you’re justified in the longer term.
With its high degree of leverage, the futures market is unforgiving of mistakes. That makes it necessary for the small trader to take his position at the optimal moment, the one during which he will know within narrow limits whether he has made a good decision or not. Between these boundaries is the area I call the “decision area” within which the trader needs to take his position or keep it or abandon it before being hurt. Since so many traders are not able to withstand a large drawdown, my task was to find a way to trade a small amount of money in such a way that profits could be made while taking the least possible risk.
ENTER FIBONACCI
The genesis of this project was my observation of the effect of Fibonacci analysis on the prices of virtually any product in the securities markets. I’m certainly not the first to notice this phenomenon of prices bouncing around between numbers whose basis is a thousand-year-old mathematical formula, but I had not seen the particular analysis of intraday price activity that I found when I started my experimentation. After watching Fibonacci calculations seeming to exert great pressure on prices in the larger time frames, I had become a fan of this method. But it was when I looked at the smaller time frames that I saw I could make the power of the study a safety factor in day trading.
Of the hundreds of mathematical studies available on computer platforms that are used to access the stock, option, and futures markets, I had found Fibonacci study to be easily the most accurate predictive study of all. It has many devotees, which I believe is, in itself, the reason it is so powerful. Some have an almost mystical belief in this system, thinking that there is a metaphysical force expressing itself in the way that the Fibonacci number series applies to things like the formation of galaxies and the shells of turtles, the golden ratio in art, and other kinds of analysis. But I think it’s enough that many traders see the effects of the study and thus they use it for guidance when they put in their orders to buy and sell. That is what makes it seem as though the Fibonacci levels are ordained by heaven itself.
The determination of “value,” meaning the right price for a securities product, is the job of all market participants, including banks, pension funds, hedge funds, and the day trader. Their opinions about the worth of things vary with changing conditions; they are always approximate, and, to a large extent, participants differ according to the time frame in which they are observed. The time frame is the most important factor for the day trader, who is, by definition, out of the market when it is closed and therefore unconcerned about whether it is going up or down in the longer term. He is interested only in the prices of things from 9:30 am until 4:15 pm US Eastern Time. During these six and three-quarters hours, prices change in ways that may well look unpredictable to those without experience and the proper tools.
VIEWING THE CHARTS
The security with which I am concerned, and which I will use in this article, is the futures contract that tracks the S&P 500 index. It is an instrument of interest to traders over the entire world and it trades nearly 24 hours a day, five days a week, and on a good day, over two million contracts will be exchanged, making it highly liquid. Liquidity is not just an advantage for the day-trader; it is a necessity. The day trader must be able to jump in and out of the market without delays. Another important advantage of trading in the futures market as opposed to the stock market is that you do not have to own the product in order to sell it. A seller can take his position in the hope of a decline in price, after which he can take a profit. This can also be done in the stock market, of course, but you need the fiction of ownership by “borrowing” the stock in order to sell it. The effect is the same as long as the stock is not difficult to borrow, but all in all, it’s easier with futures, especially in day trading.
There are two basic ways of describing the financial markets. One is appropriate for longer-term investors: it concerns itself with the fundamentals of financial products, the analysis of the economy, monetary system, and so on. This is usually applied to the equity market by people who want to find the best stock to own for the next 20 years. The day-trader is not interested in the next 20 years, and he is not interested—at least immediately—in the balance sheet and quarterly report. But he is interested in the first effect that those things have on other people, mainly other traders. And where others may use the daily newspaper, or even listen to the CEO’s conference call to decide what’s valuable, the day trader, along with others traders, uses intraday charts. The charts tell him what effect the CEO’s call had on other market participants. They tell him if people are more enthusiastic about buying than selling, or the opposite. The charts are pictures of the “drama” of the market. These images tell a story that can be grasped immediately, which reams of written data cannot.
In Japan, in the 17th century, charts were hand-drawn by rice traders, and even some contemporary traders have drawn their charts by hand. Those were naturally daily charts, but with the conquest of the computer in the mid-’90s, everything changed, and intraday charting came into its own. The computer does it easily, manipulating data and putting it in a form that can be appreciated at a glance. The trader can use these charts to find those areas where price may be too high or too low, that is, whether the instrument has value or not, even on the most fleeting basis. I think charts have become ascendant because most people are visually oriented and like the perspective that charts can provide.
The chart that I believe is best for the small trader—since we’re interested here in safety—is one that is of a very small time frame. I prefer two minutes; others like “tick” charts, which paint bars (or candles) according to a specified number of trades. These are best for the “scalpers”—so-called because of their hit-and-run style, taking a little out of the market here and there—because it is the safest way to be in what could be a dangerous environment. There are longer-term investors here, too; the two classes of market participants are there together, but it’s the scalpers that determine the minute-by-minute ups and downs of the price action. It is the scalpers who are making their living on this price action, minute by minute, in between and sometimes using the activities of the long-term investors as grist for their mills. Of course, they are equally grist for the mills of the long-term investors. Fair is fair.
Though this is an arena for long-term investors in the end, it’s one that could not exist without the scalpers. It is supported by the scalpers in the same way that our farmers are supported by the speculators who are willing to buy their crops before they have even sprouted from the ground. The farmers could not remain in business without the speculators, and in the same way, the investors need the scalpers to function.
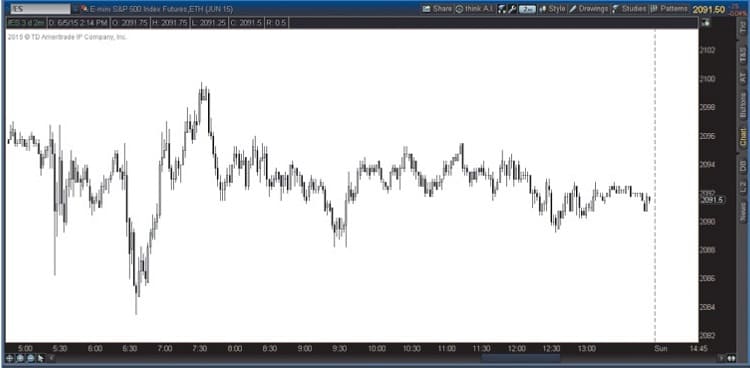
Let’s look at a basic intraday chart in Figure 1. There’s not much to go on here. The chart (one day in two-minute increments) makes market action look like a brawl. Sometimes the buyers are winning and sometimes the sellers. It looks like there’s no way to predict what will happen next. Clearly, the chart, in and of itself, is not enough. This is where the Fibonacci tool makes itself felt in the intraday environment. The tool—as opposed to the Fibonacci mathematical system that gave birth to it—is another invention of the last few decades: mathematical studies applied in visual form to price action. The wild-looking chart that you saw in Figure 1 can be tamed to a large degree with this tool. It clearly puts some order into the chaos of the chart in Figure 1.
The chart in Figure 2 has horizontal lines (blue on my charts) laid across the price activity that were calculated by the Fibonacci system. You can see in this chart how the price often pauses at the blue lines, sometimes right on the tick, or sometimes clustering, and then often turning to go in the other direction. It is almost as though the price was poured into an oddly shaped mold, the Fibonacci lines being its edges. There is occasional spilling over, but it is unusual for price to ignore these lines even at times when excitement and volatility are high.
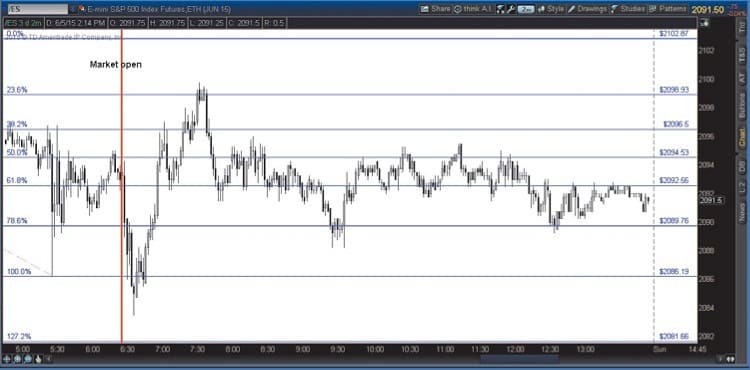
Those Fibonacci levels are landmarks in the alien territory that we saw in the first chart, a wasteland that gave no clues as to where we were or what to do. You need to have something to judge whether the product you are trading was well or poorly priced. With the Fibonacci levels, you don’t need to buy or sell blindly with no good idea of whether prices will go up or down; instead, you have something to go by.
WHAT ARE THE CHARTS TELLING YOU?
Now that you have the Fibonacci levels on the chart, the next step is to figure out what they are telling you. In my observations I have found that they are, sometimes for just moments, the boundaries of what we call support & resistance. This idea may be the most important one in the world of trading. The trader’s idea of support & resistance will be his reason for buying or selling or doing nothing. When the trader believes the price of something is at support, he will be willing to buy, and when it’s at resistance, he won’t buy, and may sell instead. Support can be defined as a level at which buyers are willing to pay up for the product in question, expecting that they will be able to get more for it in the future, even in the next couple of minutes. Resistance, on the other hand, comes about when buyers are no longer willing to pay up, and also where the sellers, a little anxious, are willing to take whatever is bid for their holdings, generally a little less than they would otherwise have held out for.
Naturally, there are many valid ways to determine support & resistance. Every trader has at least one, and I am not trying to gainsay any other theory. But the evidence I have found shows that the delineations that result from the proper use of the Fibonacci tool become excellent estimations of support & resistance, at which times a majority of orders moves the price either up from support or down from resistance. Traders will respond to these numbers as definitions of the high and low of an area of value.
Advanced Books and Courses on Day Trading & Scalping
But is every Fibonacci line a level of support or resistance? From the chart in Figure 2 you can see that price often changes direction at the blue lines. But these numbers are not always exact, and sometimes the turn is too small to be of use. You need something else to give you the confidence to take a position, and to assure you that the change in direction you expect will have some follow-through. The thesis here is that there is an important relationship between the price and Fibonacci levels, but this fact turns out to be insufficient by itself for effective trading.
ADDING CONFIRMING INDICATORS
The Fibonacci tool is not magical. What is needed is one more indicator that will act like a compass at Fibonacci levels, telling you which way to go, whether it is appropriate to take a position or not, whether to buy or sell, and whether there may be follow-through from the point at which you take a position. It’s another of those mathematical studies made visual: the stochastic oscillator. There are others of this variety, but I like this one.
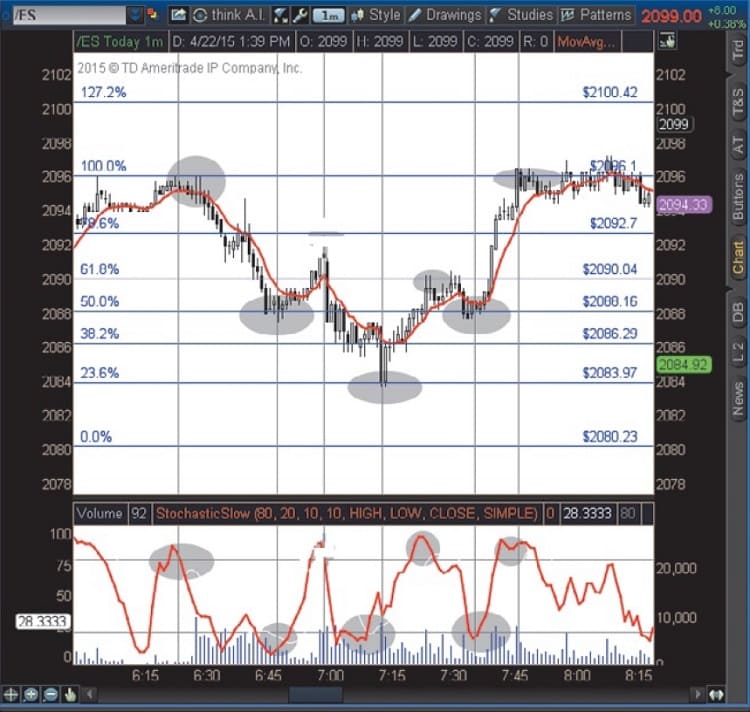
Notice on the chart in Figure 3 the coincidence of price meeting a Fibonacci level and the position, high or low, of the stochastic. (The ovals are drawn at the same times on the upper and lower panels of each part of the chart. This is the coordination you’re looking for.)
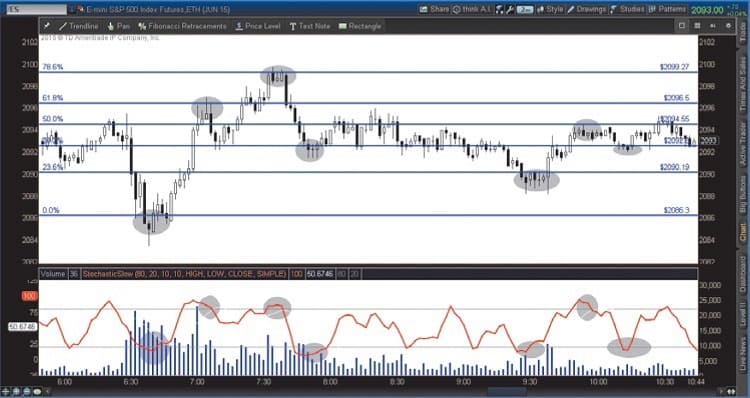
It’s clear on this chart that the meeting of price and the Fibonacci levels combined with a high or low level on the stochastic gives a good indication of what will happen next. The probabilities are very high that this combination will be predictive of the direction that price will go, and that there will be enough follow-through to make the trade worthwhile. You don’t want to make a trade only to have the thing do an about-face as soon as you click the buy or sell button. Ideally, you see the price rise along with the stochastic and then see the price meet a Fib level while the stochastic is high in its range. That will signal an opportunity to sell. It’ll be the opposite for buys.
CALCULATING FIBONACCI LEVELS
Here’s how the Fibonacci tool is used to create intraday levels of support & resistance, creating some order in the chaos. On the two-minute chart in Sidebar Figure 1, the trader simply, before the market opens, drags the drawing icon labeled “Fibonacci retracements” from the low of the overnight session to its high (the areas designated by the red squares).
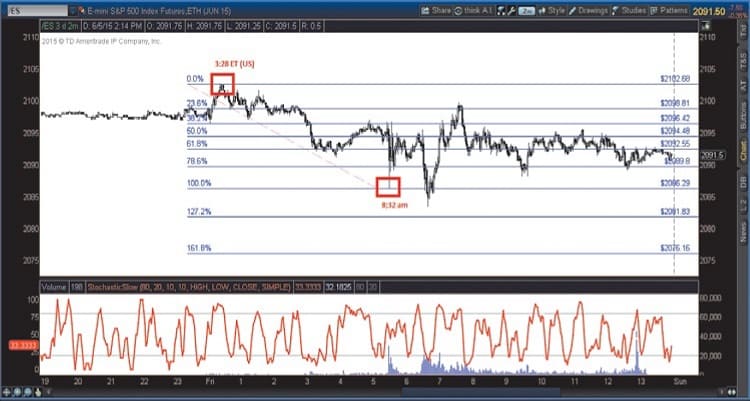
The numbers upon which the lines are based correspond to percentages of the range of that overnight session (38.2%, 50%, 62.8%, etc., up to 423%). You then do the same thing from the high to the low so you have numbers that would be appropriate to the market going lower. This way, you’ll be ready for anything.—P. Hill
By the time the market opens, Fibonacci calculations have been made for the day: the levels are on the chart. (See sidebar “Calculating Fibonacci Levels” for the method of deriving these numbers.) At the open, or even earlier, we look for an indication of which way prices will go. Where is the Fib level? Is the stochastic high or low, if either? These are the things that will give indications of what the market wants to do.
The chart in Figure 4 shows the first two hours of activity of the S&P e-mini futures contract on a recent day. (The vertical lines are put in to show the connection between the stochastic and price levels.) You can see that price opened (9:30 am Eastern Time, the first of the vertical lines) up against a Fibonacci level at about 2096 and the stochastic was quite high in its range. This made for a reasonable sell of the contract, which went down to 2083 before reversing for the day. There were various points at which you could get in or out, but the possibility is clear that a skillful trader might have captured 13 points on this contract.
Small time frames like this have the advantage of letting the trader know quickly when a trade is not working as expected. A large trader might use a five, or 15-minute, or even larger time frame because he doesn’t need to worry as much about the drawdown that can happen while a single bar (or candle) is being painted. If a small trader tries to use even a five-minute time frame he may find himself in trouble before he knows it. That, combined with the use of the Fibonacci system, is specifically geared to keep the small trader out of trouble. The trader has what I am calling a “decision area” within which he is safe. The large trader might be able to afford to take 15 minutes to make his decision, but the little guy has sometimes only a few moments. You want to quickly know when you are wrong. You need to have guideposts that you respect because otherwise you will be tempted to think that you know better than that mathematician who is long dead, and try to pit yourself against the market, which is always a mistake.
I believe that this system, simple as it is (one chart with two indicators), would provide a way for the small trader to function in the market without taking a lot of risk. I think it’s just what is needed by so many who inhabit the chat rooms on the Internet waiting for gurus to tell them what to do. This can be learned by anyone and can give all the guidance that a guru could give, at least insofar as daytrading index futures is concerned.
This system, simple as it is (one chart with two indicators), would provide a way for the small trader to function in the market without taking a lot of risk.
THE TRADING PLAN
You can see in the chart in Figure 4 that the system does fail at certain points, mostly when the market is volatile. However, these instances are so rare that a trade will be safe from any serious drawdown as long as the trader always uses stop-loss orders, especially for those volatile times, and as long as the trader respects those orders. The stop-loss order has to be unquestionable once it has been decided generally how much the trader can afford to risk on a trade. In my back-testing, I’ve found that the price will only rarely overrun the Fibonacci level by more than two points before going in the desired direction, so I use a 10-tick, or 2½ point, stop-loss, and it is rarely hit. Taking these losses is not terrifying as long as I know that the ratio of wins to losses is positive, and as long as I keep my trade size appropriate to the size of my account, never risking more than I can afford to lose.
With these things in mind, the trader can see what the uses of the Fibonacci levels are. They define a place on the chart with the number that may well be the exact point at which the price turns. My view is that it is good to put orders to buy or sell the Fibonacci numbers as early as possible. Discretion has to be used in this situation: be wary of a fast-moving market. Each trader is competing for a place in the queue of the exchange, which will execute orders on the basis of the time they were entered. If all the traders who are looking see that 2089.75 looks like a good number to sell, they will be putting in their orders to do so as soon as they can. If I am late in deciding that it would be a good deal, my order may not be filled. My order will be left in the queue while those ahead of me will get into the market. Then, next time, I will have to get ahead of the others by using a lower number for sales and higher for buys by a tick or two, which may work but which will make my stop-loss more vulnerable. This may not be a terrible problem, but it is something to consider. It is always possible to cancel orders that look like they might be overrun because there is too much volatility or the stochastic is not in the right position for that particular trade.
Finally, though this is not an attempt to cover all the aspects of trading, I would be remiss if I didn’t remind anyone who wants to use this system that it is always necessary to keep an eye on the general conditions of the day, especially the breadth indicators that will warn the trader of volatility and direction in the wider market. For example, if there is a strong trend in the downward direction, it doesn’t mean that he can’t take countertrend trades, buying significant levels, but it does mean that he is in more danger doing so, and should not expect as much from that buy trade as he would get if he were selling a good number that he could go with for a longer, and better, trade. Going with the trend of the day is normally best, as usual, but days without trend are as promising for this system as trending days, and possibly safer.
- Peter Hill was an equities trader until he made a bad speculative investment in English real estate. The loss of capital in that deal led him to feel the need to use the higher leverage offered by the futures market. After investing a great deal of time and money in learning how to trade in the futures markets, he came up with a methodology to trade that offers discipline and reasonable expectations of what might happen in the markets.