Trading Articles
W.D. Gann’s Same-Month Futures Charting Method Explained
Frequently, new students of the Gann methods become mired incomplexities even when several of the most simple and powerful Gann concepts are so easy to understand and apply. For example, no market master before or after Gann has recognized the importance of treating each commodity contract month as a separate and complete entity. Gann’s remarkable principle (an observation made over 50 years ago) that a mathematical relationship and a continuity in price extending over years of time exists in the same contract month is a tribute to Gann’s genius that proves itself over and over again even in today’s high-tech markets.
The rule, requiring weekly and monthly charts of an individual contract month to be plotted in continuity from year to year applies to all futures markets. Since soybeans were one of Gann’s favorite markets, we’ll use it to illustrate how relevant the principle is (combined with other Gann methods) to market analysis that leads to low risk, profitable trading. There are several reasons why Gann insisted that this was the only way to chart commodities. Principle number one being the following: To retain mathematical purity for price projections, Gann taught that significant highs were mathematically related to historic lows and/or historic highs.If one uses weekly and monthly commercial charts utilizing “nearby futures” updating, lows and highs of price swings from different contracts, they will produce erroneous results for range calculations and price projections.
Mathematically, it’s like mixing apples and bananas. “Nearby” charts can also show double or triple tops or bottoms that when compared to “same month” charts, they do not, in fact exist. A powerful example of how important this occurrence is at the all time high in soybeans.
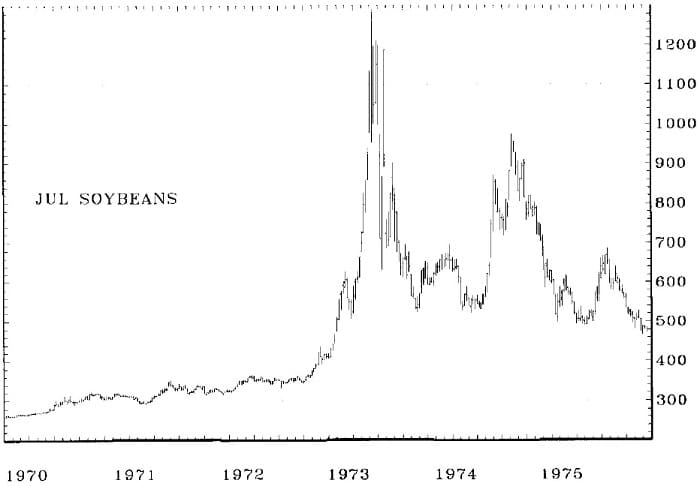
The current historic high in soybeans was made in June. 1973 in the July contract. In 1972, the July contract took out its own historic high from 1948 entering new uncharted price territory. A Gann analyst would take the old high, 433, multiply it by two, and then by three (three is important in Gann methods). When prices sailed through 866, it was clear they were headed for higher levels. Multiplying 433 x 3 = 1296; this calculation missed the 1290 high by only nine cents.
Advanced Books and Courses on W.D. Gann Methods

Logic and reason would tell you otherwise, yet 25 years later, the July 48 high helped identify the 1973 high. Of course, other Gann techniques must be used to confirm such calculations but it begins with information from a continuation of the same contract month. November soybeans have their own unique signature that differs widely from the July contract. The all time low of November beans was made in February, 1940 at 191 1/4. In 1974, 34 years later, this contract made new historic high at 956, an “exact” five-time multiple of 191 1/4.
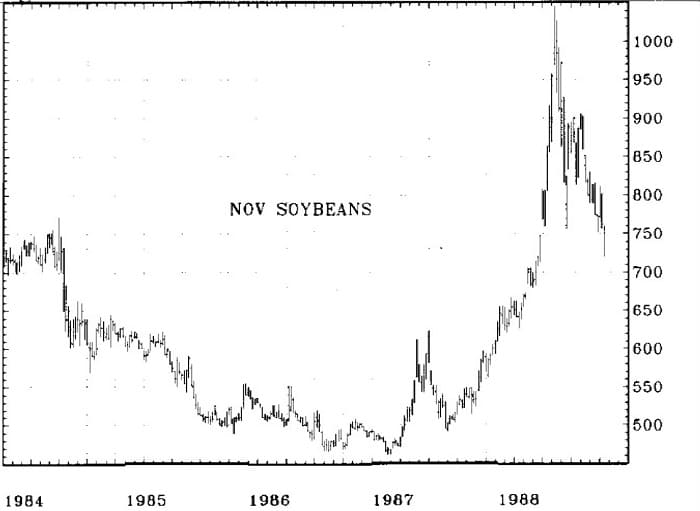
In 1983, November beans made a new historic high at 968 but even then, nine years later, that five-time multiple still held its ground as resistance. Although November, 1983 soybeans made three attempts, there was not one close at or above 956 and the third high was the top of the market. Also coming into play at that top is Principle number two: When two contracts (or more) of the same month but different years are trading simultaneously, all the angles, Midpoints, support and resistance apply equally to both contracts.
In August, 1983, while the powerful bull market was in progress, the November, 1984 contract began trading. It opened $2.50 below the November, 1983 contract. Plotting it on the weekly November chart showed that the distant contract was far below all the angles supporting the front month and bearish in a bull market. In August through early September, 1983, while the front month November, 1983 made a top at 968, the distant November, 1984, on the same chart, made a triple top at 721. Few traders, other than a Gann trader with a November continuation chart up to date, could have had the foreknowledge to anticipate and trade the top (other Gann methods were used for confirmation). Incredible as it may seem, history repeated itself five years later in 1988. When November, 1988 beans hit 1046 in June, 1988, the November, 1989 contract made high at 793, $2.53 below the 1988 contract!
While the November, 1989 contract was duplicating weakness seen at the 1983 high, another illustration of the value of keeping continuation charts was occurring simultaneously. Most Gann traders keep at least three separate soybean contract charts: November, May (Gann’s favorite contract) and July (it contains the historic high for all contracts).