Trading Articles
Channels In The Forex Markets By Gareth Burgess

This trading setup will stop you from being shaken out of your positions in any time frame. The foreign exchange markets are an arena of competing forces constantly in conflict with each other. The markets are torn apart by worry, uncertainty, doubt, fear and greed, not to mention profit. As a consequence, many traders get shaken out of their positions by a short-term wave of opposing news. Even when a position is showing a profit, there is never a certainty that the market will continue in the anticipated direction and there is almost the same sense of relief when getting out of a good position as in liquidating a bad one. As a result, many traders tend to play a zero-sum game. When they see a profit, they take it. When they see a loss, they run it.
A successful trader must trade from a known plan — one that not only supports the direction of the position in the market but also helps to remain confident in the original decision. In this article I’ll demonstrate that if used properly, technical chart analysis can be accurate and profitable, especially in a trending market.
A TRENDING MARKET
A trending market is where the best percentage trades are to be found, but catching the trend is easier said than done. Many traders will spend their time looking for a reversal instead of remaining with the trend by simply working from one side of the market — that is, the buy side in a bull trend or the sell side in a bear trend until the trend is over.
But if catching the trend is difficult, then remaining with the position is even more so. Applying a channel to the trend, however, can determine where the price reaction is likely to continue and where it may falter. This is technical analysis, but all too often the trendlines are not accurately placed, which can be misleading when looking for areas of support and resistance. In the following example, I will demonstrate how to determine if a trend is unfolding and where to apply accurate trendlines to establish the channel. This technical setup will stop you from being shaken out of your positions, especially on the longer-term time frame. By the way, it does not matter what time frame you use; you will find that the same technical criteria applies, even to the five-minute time frame!
THREE-POINT TOUCH
First and foremost is the three-point touch. Until the investor sees the three-point touch materialize, there is no basis for a channel. The three-point touch consists of two reaction lows and one reaction high in a bull trend or two reaction highs in a bear trend with one reaction low, which will then allow the first of the two trendlines to be established, regardless of whether the line passes through the prices at a later point in the trend.
To find these reaction points, you need to see the market breaking out of a range. A move higher (or lower) with two or more consecutive higher closes could be the signal that something has changed. This is something you will have to backtest. It doesn’t matter exactly how the trend starts because you need to have the reaction points, which only form after the trend has already begun.
At the start of any potential trend you must look for the two reaction lows with a reaction high (in a bull trend) found between these two reaction lows. It may take practice to establish the channel points, but the rule of thumb is to wait until there are two reaction lows and then find the highest price level between those two reaction lows (again, for a bull trend). Once these points are established, you can attach the lines and they remain there for the duration of the trend and longer. The daily chart of the British pound/US dollar (GBP/USD) in Figure 1 displays the beginning of a trend channel quite clearly.
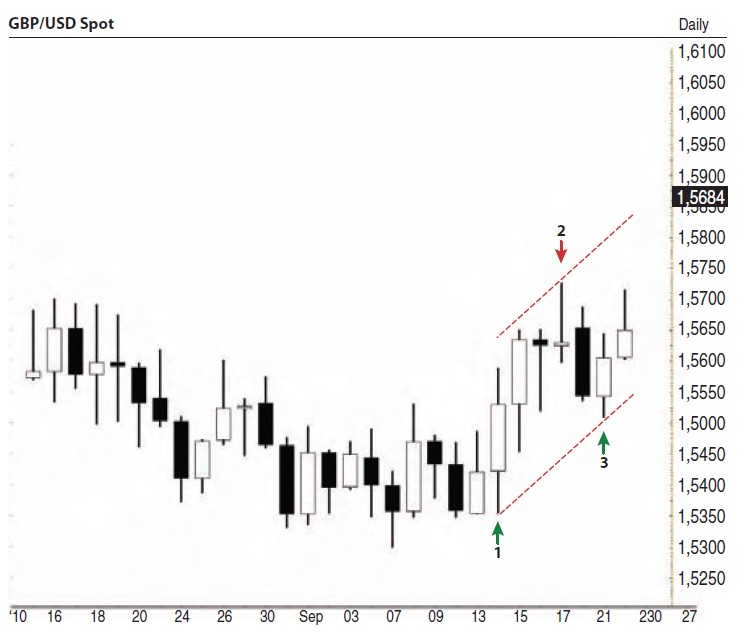
There are, of course, many ways to enter a position into the market, and timing your position is just as important as managing the stop-loss. For the sake of argument, let us say you enter a position on the break above the high of the doji as seen in Figure 1 (if you are a candlestick trader, this method will be familiar to you). Once your position is in the market, your initial stop-loss can be placed just below the second reaction low, knowing that the market will not return to that price level while in the channel. And once the market moves in your favor, you can bring the stop up slightly. Of course, it would be possible to enter a position on the break above the high of the daily price range that formed at the second reaction low.
Suggested Books and Courses About Forex Trading
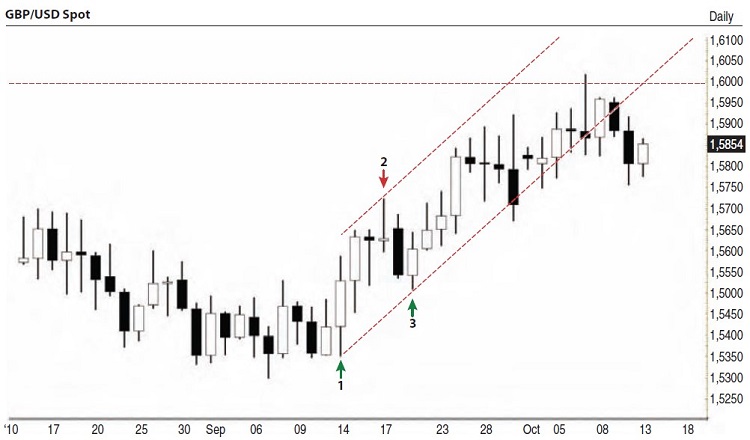
These are basic observations, of course; every trader has his or her own preference. The point is to have a strategy based on the plan you are creating by using and applying the channel. The reaction points are there for you to feel more confident in a possible trend channel unfolding. Later on, once the trend channel has been established, it is possible to gauge the strength of the trend by observing the price action against the channel lines. Figure 2 shows how the lower channel line warns you about weakness setting into the trend, but more important, it helps you stay with your position. Only a clear break below the channel line makes the bullish trend look suspect and a break below the lower line warns you the market is about to move into a correction phase. But you can leave the lines on the chart in case the price action returns to the channel.
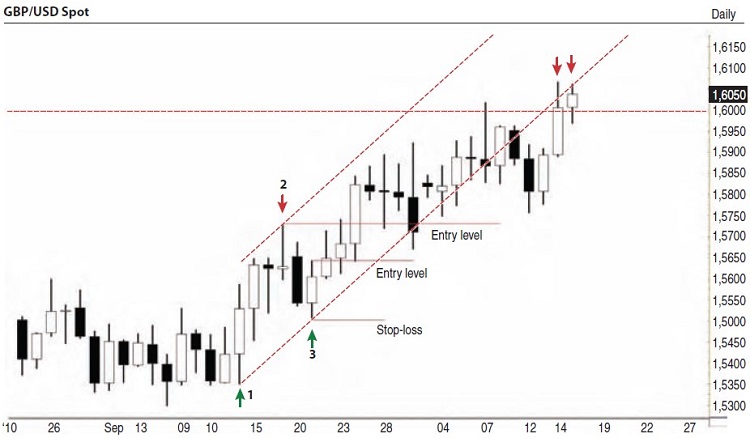
In Figure 3 you see how the channel can still be used to gauge the market, even after the price action has left the channel. Although you may have closed out your position due to the market breaking below the lower trendline, the resistance at the lower channel line could be used for short-term trading or as a potential target. Thus, it is useful to keep the channel on your chart, even after price action has moved away from the channel. The three reaction points can help you recognize the beginning of a trending market, but the real profits come from staying with the position and, as I have demonstrated, by using this method you can establish your position and remain with it even during those uncertain days when news or hysteria hits the market.
MORE TECHNIQUES
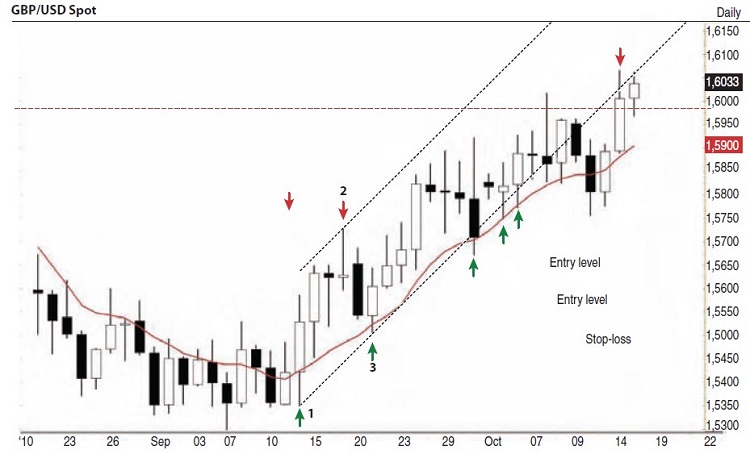
There are other techniques to add to this channel, and you can experiment with other indicators and then backtest. Two techniques I find reliable are the moving average and Fibonacci ratios and projections. These can help you maintain your position as they help to keep the price action within context. In Figure 4, the 10-day simple moving average (SMA) has been added to the daily chart of the GBP/USD. This shows how the market finds strong buying when the price reacts with the SMA. Your position has been established but when you see the price action below the lower trend channel, you may be concerned, and rightly so, as you do not want to let any profits that you have accumulated diminish. Seeing that the market finds strong support at the 10-day SMA would help you stay with your positions. If you apply a filter of, say, two daily closes below the SMA, you would not have closed your position when price dipped below the lower trendline.
The next step is to try to establish potential targets. In this case, you would look at where continued bullishness will take the price action. Applying Fibonacci projections works well when you are trying to establish profit targets. The key to establishing the projected targets, however, is in finding the right levels to project from. Again, this is where the three reaction points (the two reaction lows and the one reaction high in a bull trend) can be used to establish the Fibonacci points of projection.
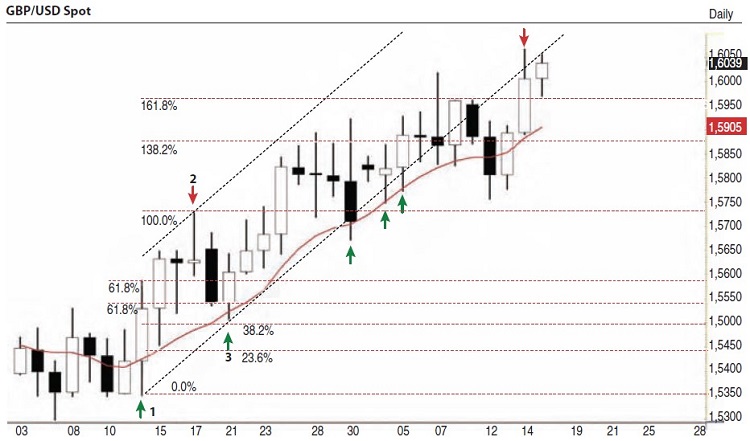
Establishing the Fibonacci retracement from the base of the first reaction to the high of the second reaction creates the bases for the retracement levels. The swing projection is projected up from these levels. As you can see in Figure 5, the market finds strong resistance at the 1.382% projection level before finally reaching the 1.618% projection level. Remember, a trend that seems congested and is rising slowly is not a good sign. It implies hope, but the 10-day moving average helps you maintain the position during such periods.
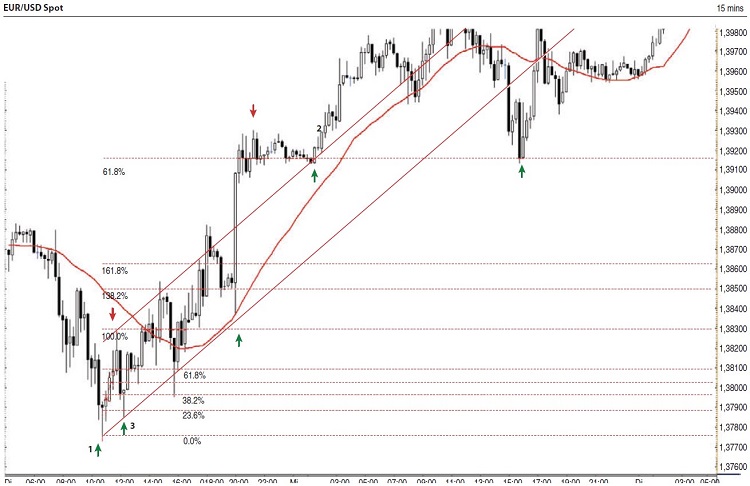
One of the advantages of the daily time frame is that you can apply daily closes above or below the technical levels of importance as filters. But the short-term time frames work just as well for the channel scenario, as you can see on the 15-minute chart of the euro/US dollar in Figure 6, so this is a useful technique for short-term trades as well.
Gareth Burgess has more than 10 years’ experience in applying chart techniques to investment analysis, creating technical views and strategies for corporate-level clients, and is a dedicated private investor. He is founder of the Chart Workshop (www.chart-workshop.de), a provider of technical views for investors.