Trading Articles
Short-Term Market Forecasting with Financial Astrology
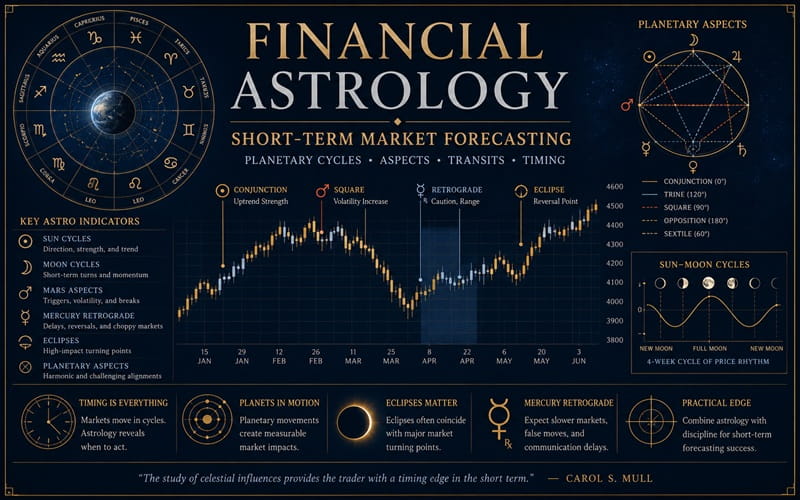
The market moves through periods of optimism, expansion, anxiety, depression, and panic, as dictated by the magnetic winds that govern the universe. These periods are known as economic cycles. Some economic cycles last for centuries, while others have a duration of only a few minutes, hours, or days. It is possible to obtain approximate market predictions via analyzing these sequences and projecting them forward, but more accurate predictions can be produced through astrology. Astrology requires the exact computation of when and where the planetary bodies will reach exact aspects such as 90, 180, 120 from one another. Correlations have been found between planetary aspects and economics cycles. Today the theory that the magnetic forces generated by planetary aspects cause cycles is gaining acceptance by cyclic theorists and astrologers.
Like all astrological forecasting, financial astrology does not yield exact results, but its study can give indications that have a high degree of probability. The best results of all can be obtained when astrology is combined with the usual fundamental/technical methods.
Sun/Moon Aspects
The astrological aspects that are the easiest to learn and use are those between the sun and moon (these can be found in an almanac). Sun/moon aspects are so important to the market that you can be correct about 80 percent of the time if you use only this type of aspect. The sun and moon are conjunct at the new moon, and unless overshadowed behavior aspects, the market can be expected to move upward at that time. The sun and moon are in square aspect (90 deg) at the first quarter and last quarter, and a bear market is the normal result. The sun and moon are in opposition (180 deg) at the full moon, which usually brings a somewhat bullish market, but is not as positive as the new moon.
Sun/moon trines (120) come halfway between the opposition and the first quarter or last quarter; they are indicators of bull markets.Since aspects cast their influences before them, the expected effect will usually come the day before the aspect is exact. When it does reach exactness, it is all over.
Sunspots
Periods of solar prominence (sunspots) pour forth energy, causing all earthly activities to increase-including stock market trading. The usual result of this stimulus is a major market turning point, either up or down.Increased sunspot activity occurs whenever the planets Mercury, Venus, Mars, and Jupiter are on the same side as the earth. The greatest influence of all this tidal-like force occurs when Jupiter and Venus are in a helio-centric line-up with the earth at 0, 45, and 90, but lesser activity produces the well-known Dow cycles of 89 weeks, 124 weeks, and 208 weeks. A very good illustration of this market indicator occurred last October 19 when the market dropped 505 points. Jupiter was exactly opposite the sun, increasing solar flares and market timing-thus forcing a turning point.So, be aware that aspects to the sun mark major market turning points, both up and down. For exact timing, you will need to construct a helio-centric chart. Most computer programs have this option.
The Total Picture-Positive or Negative
Another valuable tool in short-term market forecasting is to tally all the aspects in the sky on a given day. This method was originated by David Williams, author of Financial Astrology, but I have altered his method somewhat. What I do is list the aspects that are within a degree of orb on a given day over New York City within market hours, plus the more important ones that fall after or before the market is open. I then assign a numerical value to each aspect: Conjunctions are ten, sextiles are three, trines ten, and oppositions six. In general, conjunctions, sextiles, and trines are positive, while squares and oppositions are negative, but this can be overridden by the nature of the planets involved. Saturn and Mars are always negative; Jupiter, Venus, and the sun are always positive.
When my list is complete I simply add my negative column, and then my positive column. If I have -84 and +15, I definitely expect a down-day at the market. Plus 64 and minus 16 would indicate a bull market.This method of analysis works because it is an overall indication of how the majority of people will be feeling. If the populace is feeling depressed and fearful (Saturn/Neptune), they are apt to sell their stock. Most Ephemeris’s (catalog-type books listing all the planetary positions at Midnight by noon] at Greenwich, England on a daily basis) have an aspectarian section. Or computer programs are available. Or ‘Dell Horoscope” magazine carries a aspectarian section in each issue. This same method of tally aspects can be used on an hourly basis, or even fifteen minutes.
Advanced Books and Courses on Astro Trading & Esoteric Methods


Another interesting experiment is to run charts for New York City for every half-hour for a given market day. Then, armed with your sixteen charts, sit back and watch the ticker tape. The sun, Mercury, and Venus will be in the mid-heaven around noon each day, which will produce a slight but noticeable rally. When Uranus is in the Midheaven, the market will be erratic; Saturn will bring a down-turn; Neptune will bring active trading in oils and drugs. Anyway, you will be able to observe the effects of different planets and aspects as they move across the midheaven on a minute-by minute basis.
Mars aspects
The planet Mars acts as a “trigger” for certain undesirable long term stock market movements, whenever this planet is square or opposes one of the outer planets. In fact, the stock market is 70 percent likely to develop a downward trend whenever Mars is in conjunction with one or more outer planets and simultaneously pattern is not alleviated by trines and sextiles. The orb for the square should be 50, but 80 can be allowed for the opposition. The following aspects are especially bad for the market: Mars conjunct Saturn, Mars square Neptune, Mars opposite Jupiter, Mars in opposition–regardless of the planet. All Martian retrograde stations should be regarded as critical to the market. In contrast, stock prices have consistently risen during the thirty days just before a conjunction of Mars with Jupiter or Mercury.
January and September Highs
The market is usually up January 9th through the 18th. This is because the sun reaches 23-25 Capricorn in mid-January, which produces a grand trifle with Mercury at 24 Tarus in the New York Stock Exchange chart, sun at 26 Taurus in the NYSE chart, seventh house cusp of NYSE chart, Neptune at 20 Virgo in the chart of the U.S.A., and Pluto at 24 Capricorn in the chart of the U.S.A. A similar effect happens each September when transit sun reaches 18-27 Virgo.
Retrograde Mercury
The planet Mercury rules trade and commerce as well as communication. Whenever it is in retrograde motion the market becomes sluggish, listless.
Eclipses
Eclipses bring an erratic, unpredictable market while they are overhead. Then, for about six months afterwards, that spot in the sky is sensitized. Whenever another planet, especially Mars, comes into aspect with that point, the market is likely to fall sharply.
Conclusion
I think of astrology as neither an art nor a science, but as a discipline. That is, it works in the same way that medicine, jurisprudence, and the ministry work. There is a body of principals and laws at the core of astrology, but these must be in the hands of a skilled and experienced astrologer who exercises capable judgement for good results. Like medicine, law, and theology, astrology may not always give quantifiable results–but it works, nonetheless.