Trading Articles
Gann 1×1 Angles, Price Scales, and the True 45 Degree Line
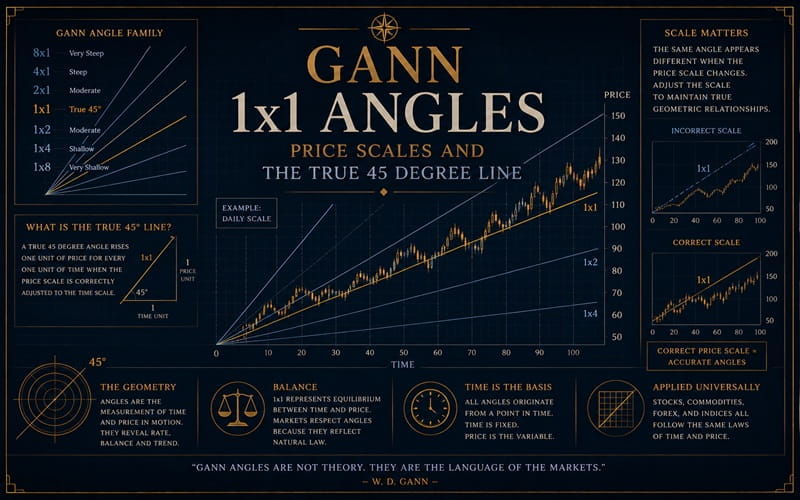
After several years of conversations on our customer support line, I have found some common misunderstandings that seem to be shared by a number of Gann students. One of them has to do with Gann’s 1X1, 2X1, 4X1 angles and their relationship with the 45 angle. In Gann’s lesson Geometric Angles he describes the 450 or 1X1 angle as follows: “The first and most important angle to draw is a 450 angle or a moving trend line that moves up one cent per week or 1 cent per month” Throughout his course material he uses the terms “45 degree line” and “1X1 line” interchangeably.
In today’s markets these terms are seldom the same. When Gann wrote his books and courses he traded the soybean market. His charts were scaled at one cent per price division so that a 1X1 line and a 45 line were physically the same angle. In to days soybean market a chart would need to be scaled at four or eight cents per price division in order to make the chart a practical size to fit on your desk. The important term is not 450 line but rather a line that moves up a rate of one cent per day, week, or month. A more descriptive term would be “True 450 or a 1X1 angle that is adjusted for the scale of the chart. On a soybean chart with a scale of 4 cents per division the True 450 would have a physical angle as measured with a protractor, of 140. (Tangent of 1/4) The line would rise at a rate of one quarter price division per time division. Since the price division has a scale of four cents, the one cent per day requirement is satisfied.
When the PRICES WITH SQUARES module is used in the Ganntrader I software program the physical shape of the plotted square is automatically adjusted for the scale of the chart. For example, a Square of 144X144 on a chart with a four cent scale would be one fourth as tall as its length. The True 450 always runs from one corner of the square to the opposite corner. You can over-ride this feature by simply multiplying the price portion of the square by the scale of the chart. This will produce a physically square.
Advanced Books and Courses on W.D. Gann Methods
Another often asked question is what constitutes a one cent movement for markets and that aren’t quoted in cents? The T-Bonds, currencies and S&P 500 are the three examples. Using a full point in the bonds such as from 86-12 to 87-12 as the basis for the lXl angle is not very practical. A full point represents 32 X $31.50 or $1000 which is too large a number for an angle that is supposed to rise one point per day, week or month. I have found that treating the 1/32 ticks as the price portion of the IXI angles works well if the entire price is plotted in 1/32 ticks. The Ganntrader I program allows you to multiply the price by any number prior to plotting. Multiplying a bond Quote of 86-12 by 32 produces a tick number of 2764. (86 times 32 plus 12 = 2764) These numbers make a better fit with Gann’s square of 90 and 144. Often you’ll find the major highs and lows are multiples of 90 ticks apart.
Commodities, such as the currencies, that are quoted as fractions of a cent should have their decimal point shifted to the right prior to plotting. The program was designed for experimentation so it is a simple matter to try several decimal point shifts until the correct one is found. For example, Swiss Francs at $6500 should be changed to 65.00 or 6500. You may also want to try to experimenting with using the minimum price fluctuation as the price value in the True 45 angle. The S&P 500 is quoted in five point increments. The True 450 angle might be one that rises at a rate of five points or 50 points per day, week or month.
Gann often charted Eggs using a scale of 13 points per price division. I don’t know if this is related to the minimum price fluctuation of that market or if he had some other reason. The charts I’ve seen have 450 angles drawn on them. With a scale of 13 per division these angles rise at a rate of 13 points per day. In his Cotton Course he describes the 450 or 1X1 angle as follows: “The first and always that most important angle to draw is a 450 angle or a moving average that moves up 10 points per day, 15 points per week or 20 points per month”. This statement would seem to contradict this rule of 1 unit of price per time unit is a 1X1 angle. For the cotton market these numbers must have proven to be the correct point values to be the True 450 angle. As a rule you will know when you have the True 450 angle when the prices in a normal Bull or Bear market follow it up and down. You should see occasional price moves above the 450 angle to the 2X1 and below it to the 1X2. When you have found the True 450 angle for that particular market.