Trading Articles
What’s Your Trading Price? By Alexander Sabodin
The most important element of a trading system is managing risk. Here’s how you can understand the risks of the forex market and other financial markets. Novice traders tend to think of trading as a unique opportunity to make a large amount of money. They slip on their rose-colored glasses and envision profits that will enable them to quit their current jobs, let them travel all over the world, and work only when they feel like it. Immersed in these rainbow thoughts, they open trading accounts, begin trading, and suddenly find themselves faced with the cruel reality. Money drains out of their accounts, followed by enormous losses that force them to close their positions. They quickly realize that the market isn’t about making money. Instead, it’s all about losing it.
Understand Your Risks
Why do so many traders leave the business after suffering massive losses? There are many reasons, and one of the major ones is that there is too much focus on potential profits. A beginning trader tries not to think about the risks, which is wrong. Understanding and taming risks may be the major component of trading forex and other financial markets. Remember, mathematicians developed the formula for mathematical expectation of profit long ago. There’s no reason to be intimidated by it, even if you are not strong in mathematics. This formula is one that we can all understand. Here’s what it is based on:
The probability of the profit you could obtain, multiplied by the amount of the profit
minus
The probability of the loss you could obtain, multiplied by the amount of the loss itself
The result will be your trading price.
This concept can be written as the following formula:
Trading price = T/P probability x T/P – S/L probability x S/L
where:
T/P = Take profit S/L = Stop-loss
To understand the nature of the formula, you need to consider the game of coin tossing. Say $10 is at stake. Assume that if it comes up heads, you win $10. If it comes up tails, you lose $10. What is the probability of coming up heads or tails? If you toss a coin 10 times, heads may fall six times, tails may fall four times; the possible ratio will be 4:6 or 5:5. In 100 cases, the ratio may be 49:51, 50:50 or close.
Finally, if you toss a coin 10,000 or a million times, it is possible to say for sure that in 50% of cases heads will come up, while in 50% of cases tails will come up. This is the law of large figures: the larger the values of a phenomenon, the closer it gets to the accidental value to the average value. Most readers will agree with the 50:50 chances. So by data substitution, it becomes easy to calculate the trading price:
0.50 x 10 – 0.50 x 10 = 0
Imagine that your friend agrees to give you the profit of $20. The calculation will now change to:
0.50 x 20 – 0.50 x 10 = 5
This means that at each coin toss, you will get on average $5. That’s not a bad outlook. It’s just a matter of finding such a friend. Let’s consider some other things. A shrewd reader would have already grasped that the most difficult variable to determine in the formula is the probability of profit & loss.
Determining The Probability
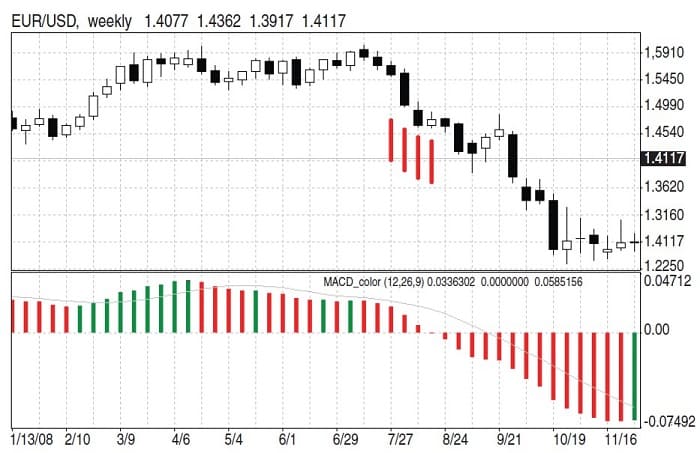
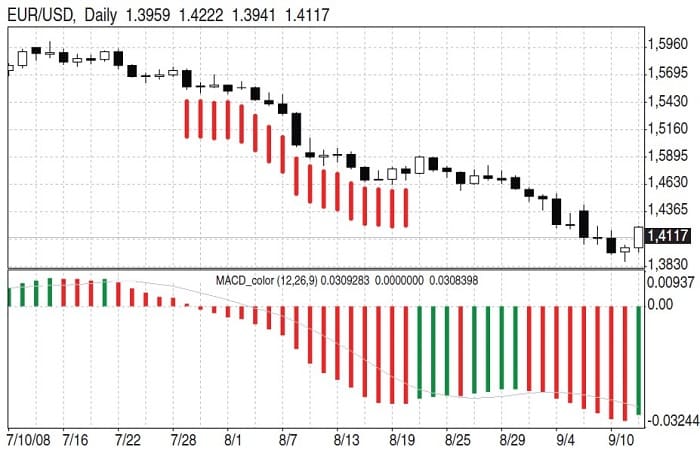
Say there are two traders, John and Harry, who trade applying the tactic of crossing of moving averages on an hourly chart. The size of T/P and S/L of both traders are also similar — let’s assume it is 50 points. The difference is that John trades in the direction of the trend based on the daily chart, while Harry tries to find the reversal point of the daily trend and opens positions against it. For this example, I am using the eur/usd pair. The trend is where the slopes on the weekly (Figure 1) and daily (Figure 2) moving average convergence/divergence (macd) histograms coincide. Since John is trading in the direction of the trend, he opens short positions. Harry, who attempts to trade against the reversal points, opens a long position.
Develop trading strategies that will bring you minimum losses instead of those that bring you enormous profits.
In Figure 3 I have marked the entry points for long and short positions at moving average crossovers using ema(8) and ema(21), applying to the close, on the one-hour chart of the eur/uSd. Those signals that generate some profit are marked with green, whereas the signals that generate losses are in red. Let us see how many profitable and false signals were generated. Even though during the flat trading period both trading techniques bore losses, in general seven out of 10 (70%) of the short trades appeared to be profitable, while three or 30% resulted in losses.
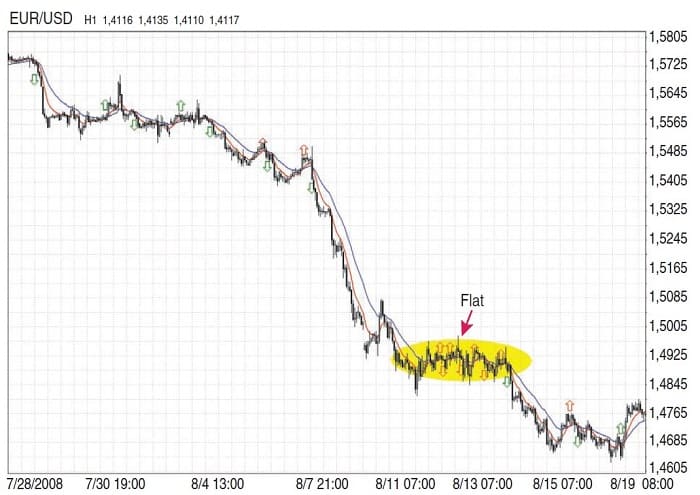
The results of the long signals during the descending trend were not so good. Seven out of 10 (70%) trades generated losses and three (30%) turned out to be profitable. Both profit and loss equal 50 points. So if you substitute these values obtained into the formula of the mathematical expectation of profit, you can see the trading price for each participant:
For John: 0.7 x 50 – 0.3 x 50 = 20
For Harry: 0.3 x 50 – 0.7 x 50 = -20
By trading in the direction of the trend, John would make on average 20 points on each position he opens. Harry, on the other hand, would lose an average of 20 on each upcoming trade using his method of trying to determine the trend reversal points and opening positions against the trend. It is not difficult to guess who will earn the luxury vacation earlier.
Suggested Books and Courses About Market Indicators

Managing Your Risks
Regarding capital management, it is important to understand that when you are gambling with a negative profit expectation, it means you have no money management plan in place. This could make you a winner once or twice if you are lucky, but without a money management strategy, if you continue gambling, you will lose your entire account no matter how large it was initially. This holds true, not just for gambling with negative expectation, but for gambling with equal chances. Therefore, the only way you have some chance of winning in the long term is to trade with positive mathematical expectation. I will divide the trading price formula into two parts:
Take-profit probability T/P value
Stop-loss probability S/L value
In this example, I have tried to explain the saying “The trend is your friend” in mathematical terms. By trading with the trend, you are more likely to achieve a profit. You should define for yourself exactly what a trend is and the parameters for that trend. Only when the trend is present should you trade in its direction. You should then try to achieve bigger T/Ps (take-profit) than S/Ls (stop-loss) in each trade. In theory, if you do this, you will reach positive mathematical expectation of profit, which is a big step toward a thriving trading career. If you are persistent and consistent, your hard work will allow you to build a bridge between the theory and its implementation in practice. Ideally, you should achieve big T/P values and smaller S/L values.
On Minimum Losses
To sum up, you should determine the trend; wait for a signal with its direction; count the ratio of possible profits/possible losses, and define the approximate time you will be in the market. These four filters will help you improve your results. If no such trend exists, you remain out of the market. Perhaps you see a clear trend but no clear signals of its direction. Or you see a trend and a signal of its direction, but the potential risk exceeds potential profit. In these cases, it is best not to jump into any trades. Instead, you should wait for further development. If you have opened a position and defined it as short term, but the day is coming to its end and the price has not reached your target, you could close your position. If you have analyzed the situation and are confident the trend will move in your favor, you could leave your position open.
There is one important conclusion that we can take away from the concept of trading in the direction of the trend: All trading systems will generate losses. Thus, you should perceive these losses as production expenditures. Develop trading strategies that will bring you minimum losses instead of those that bring you enormous profits. However, make sure you are taking an enhanced risk for your deposit.